Dear all,
Thank you for your attention.
Running Arcmap 10.1.
I am brand new to this software and at this point I need this software to visualize the data generated from other program on the research basin.
At the moment I have a data set table in .csv which contains 603 columns. Column 1 for latitudes column 2 for longitudes, and column 3 to column 603 are data for each grid point(shown as black dots in figure 1) in 600 months. So basically my dataset is in format like this:
| y | x | month1 | month2 | month3 |
| 21.5 | 106.5 | 0.21064 | 0.070961 | 0.04823 |
| 21.5 | 107.5 | 0.11599 | 0.55193 | 0.6087 |
| 22.5 | 105.5 | 0.015563 | 0.016393 | 0.014246 |
| 22.5 | 106.5 | 0.034474 | 0.025667 | 0.002998 |
| 22.5 | 107.5 | 0.088733 | 0.71231 | 0.77644 |
There are 64 gird points and 600 months in total and each point is separated by 0.5 degrees,
I did tried to search topics like importing xyz data to arcmap and followed the instructions to add data and display xy data, but all i got is map below. I also tried to follow the Arctoolbox, but I failed at the very beginning when I tried to convert the file(Arctoolbox>3D Analyst Tools>Conversion>From File>ASCII 3D to Feature Class/Point File Information)
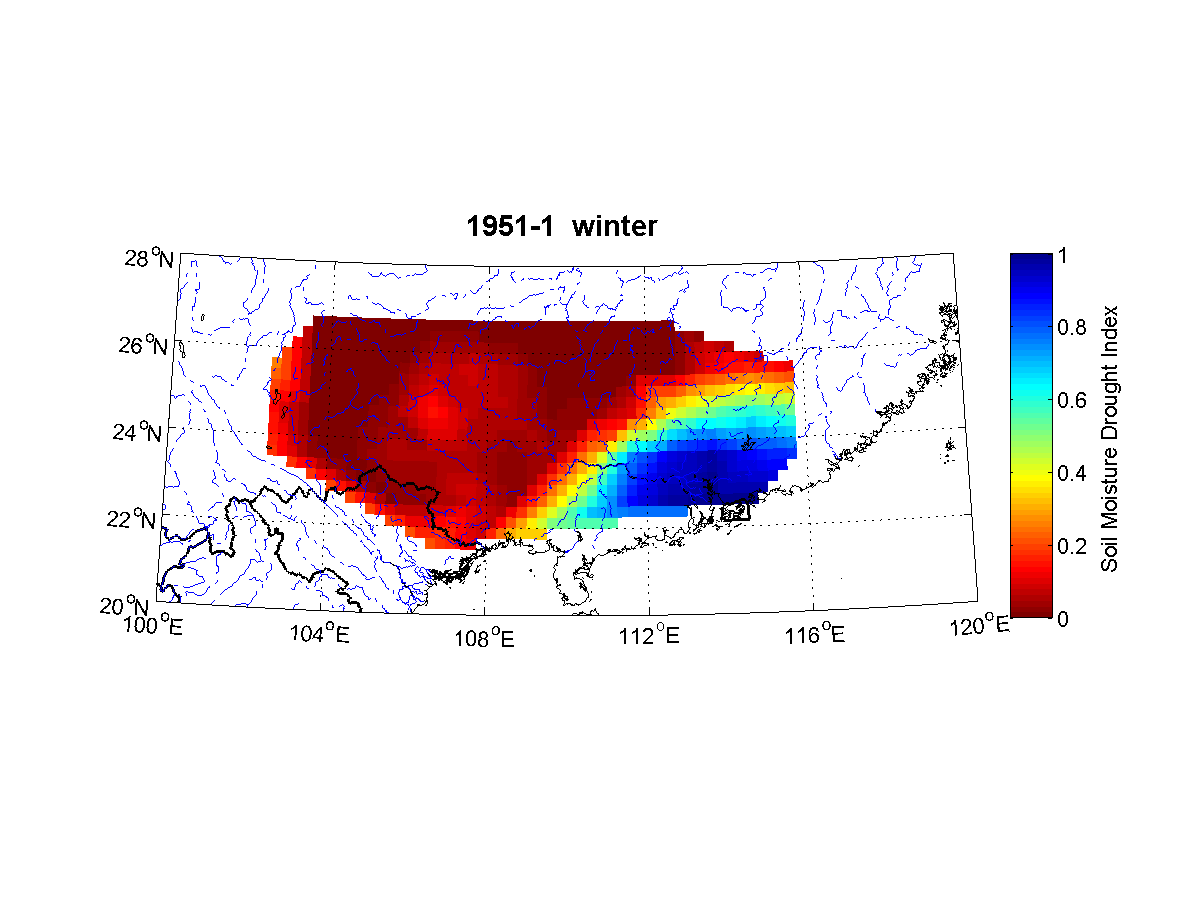
What I want in the end is plotting data on the map like I did in Matlab(shown in Figure 2) but in a shape more like a basin instead of mosaic one. And also in Matlab all the drawings(600 pics in this case) can be saved without doing it manually once the coding is right. Can I do this in Arcmap? I guess there is a more straightforward way to import this data and interpret it smoothly like meteorological application.
And another alternative I think is out of Arcmap and with the help of photoshop I may be able to "cut" colored area into a basin shape and batch processing in PS for 600 or even more pics. But I don't want to go to this stage really as I have this professional software that is well applied in meteorology aspect.
I do not come here if I never tried to learn and solve it by myself. Since I am totally new to this software, please don't mind if I have asked any stupid questions. 
thank you for your time and attention again.
looking forward to your answers.
Regards
figure 1: grid points and research basin:
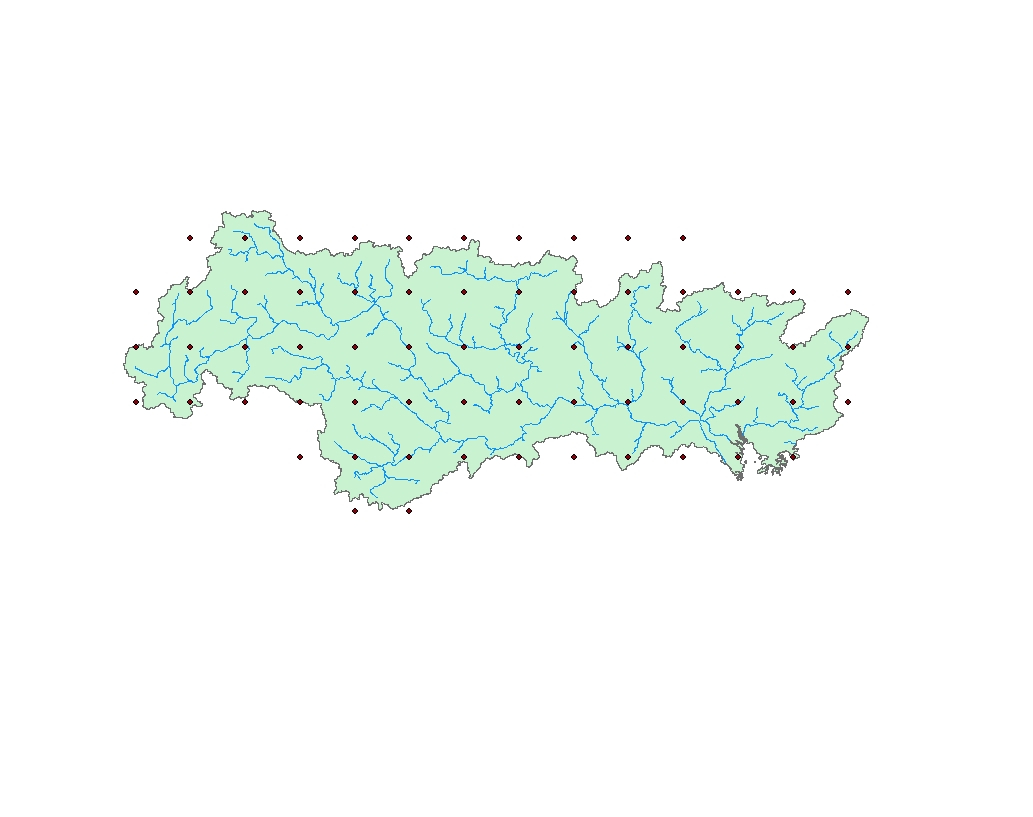
Figure 2: mapping using the column 3 data for same area in matlab(by interpolation to a finer resolution 0.25*0.25)