Hi,
I am testing this great new feature in the latest Cityengine release which allows us to create nice dashboards using Reports.
But I don't understand how to select multiple attributes/reports to compare different modes.
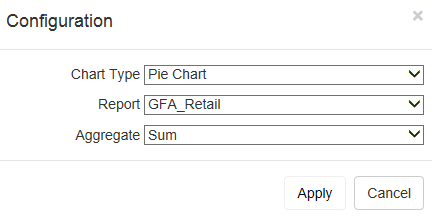
in the configuration panel I can only select one Report:
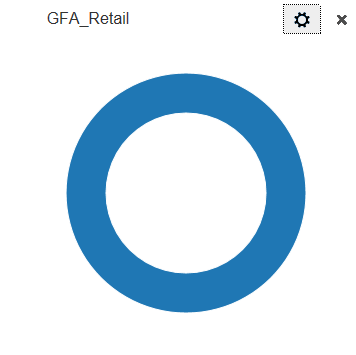
And I get:
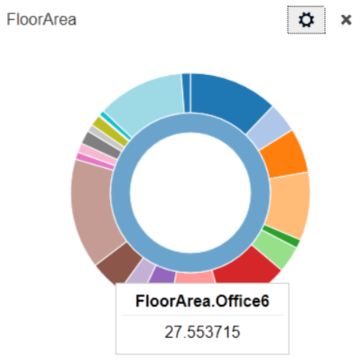
And of course I'd like something like:
In the documentation its says:
If you select a report with sub-classes, only the Pie and Column charts will display all the sub-class values. Key Number will just display the main class. For example, TotalEnergyByClass is divided into the following sub-classes:
- TotalEnergyByClass.C
- TotalEnergyByClass.D
- TotalEnergyByClass.E
- TotalEnergyByClass.F
- TotalEnergyByClass.G
When you generate the report the Dashboard displays all the sub-classes values.
Could someone explain how to create classes and sub_classes in a Report ?
Thanks.


