Hello everyone,
I have done a habitat suitability analysis for giant pandas in Wolong Nature Reserve in China. I also did a sensitivity analysis to see how different parameterisations of habitat characteristics would influence the output. This resulted in a lot of different maps like the ones below.
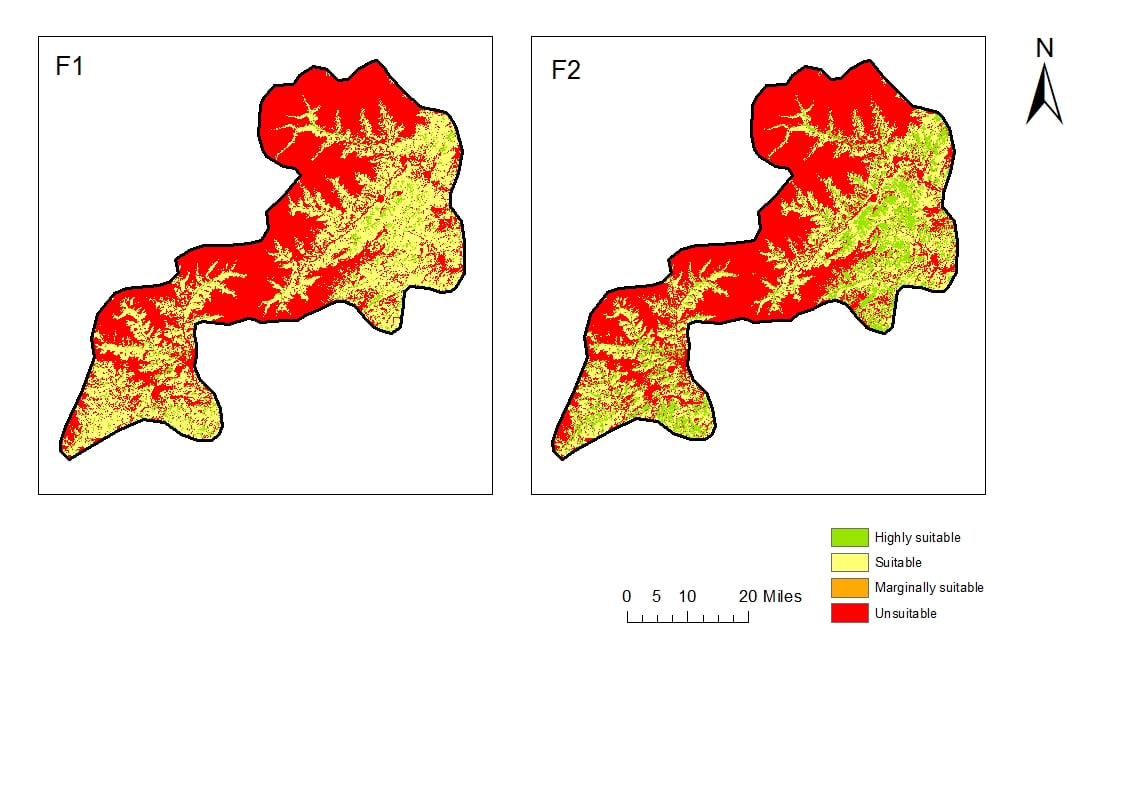
I am now wondering, if there is a way to overlay all these rasters with a tool that will kind of spatially illustrate the likelihood of one area to be highly suitable or suitable or marginally suitable etc. ... I would like to avoid tools that can only compare two maps at a time.
Does anybody have any ideas or suggestions? Thanks very much in advance for any help. 
Cheers,
Carina


