Practical GIS Mapping with JSON Geometry Data
ArcGIS for Excel brings GIS mapping capabilities directly into the familiar environment of Microsoft Excel, enabling users to map and interpret geographic information with ease and familiarity.
Goal
The goal of this blog is to explore three unique scenarios that showcase how ArcGIS for Excel mapping tools can be effectively applied in different real-world situations from different user perspectives.
These learning examples illustrate the versatility and practical value of combining GIS technology with Excel’s data management features. Whether you're a data analyst, educator, or someone curious about spatial analysis, the following examples will provide insight into how mapping with JSON geometry data can enhance your projects and decision-making.
Scenario 1: Mapping travel routes
This scenario demonstrates how to transform tabular location data into route geometries and display them as travel paths on a map.
- Prepare the route data. Start with a worksheet that includes one row for each morning jog, including the run start time and destination or route endpoint.
- Generate route geometry. In Function Builder, use the FINDROUTEBYADDRESS ArcGIS function and select the “Walking Distance” travel mode.
- Review the output columns. Confirm that the result includes “Distance Traveled” and “Route Shape” columns. The “Route Shape” column contains EsriJSON polylines that represent each jogging route.
- Add the routes to the map. Open the map, add a new layer, select “EsriJSON Geometry” as the location type, and choose “Route Shape” as the input column.
Result: The jogging routes appear as line features, helping users compare distance, direction, and neighborhood coverage across the month.
Scenario 2: Mapping using GeoJSON data
This scenario demonstrates how to import GeoJSON files into ArcGIS for Excel and use them as geographic features that are ready to map.
- Explain that GeoJSON is a common format for sharing geographic features such as boundaries, waterways, and other map-ready datasets.
- Download boundary data. Ask students to download the GeoJSON version of administrative country boundaries from the World Bank.
- Import the GeoJSON file. In ArcGIS for Excel, select Add Excel layer, then choose “JSON file” from the “Data” dropdown.
- Add the layer. Click “Add” to display the country boundary polygons on the map.
- Share the result. Publish the mapped layer to an ArcGIS Online account so it can be shared and reused.
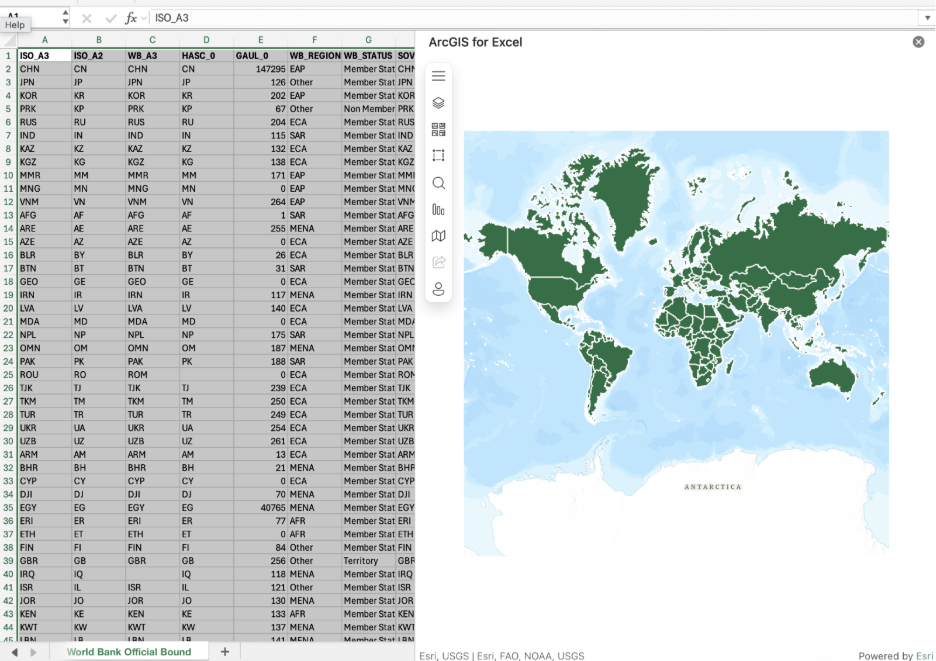
Tip: Use open-source GeoJSON datasets to practice importing real-world geographic data, comparing feature types, and styling map layers by attributes.
- Add the waterway geometry. Download the GeoJSON file, import it into Excel, and add the waterway geometries to the map.
- Style by category. Open “Symbology,” select the “waterway” field under “Attributes,” and style the layer by unique values.
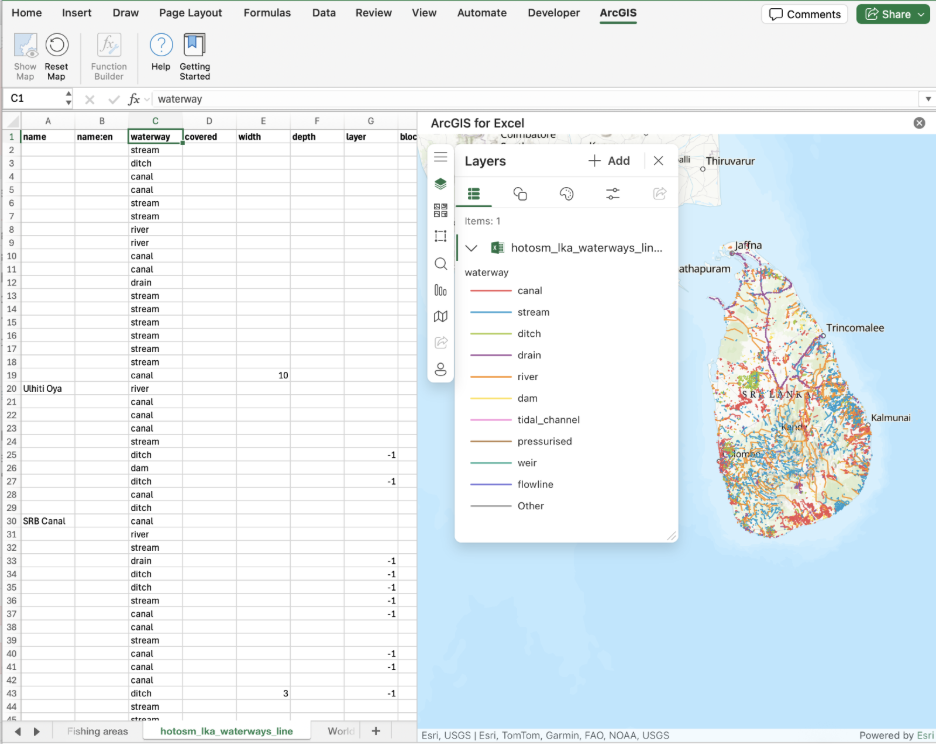
Result: Students can compare different feature types, such as country boundaries and waterways, and use symbology to style categories for clearer visual interpretation.
Scenario 3: Creating area divisions and calculating geometry in Excel
This scenario demonstrates how to convert coordinate data into polygon geometries, map them as operating areas, and analyze them directly in Excel.
- Prepare the vessel data. Start with sample data that includes fictitious coordinates for the three corners of each vessel’s triangular operating area in the South China Sea.
- Create polygon geometry. Use VERTICESTOESRIJSON to convert the three coordinate vertices into triangular EsriJSON polygons.
- Add the polygons to the map. Add the generated EsriJSON polygon data as a new layer on the map.
- Calculate each area. Use GETPOLYGONAREA to calculate the size of each fishing zone directly in Excel.
- Check for overlaps. Run the RELATEGEOMETRIES function to determine whether one vessel’s fishing area intersects with another vessel’s assigned area.
- Highlight potential conflicts. Apply conditional formatting to the worksheet to quickly identify vessels with overlapping areas.
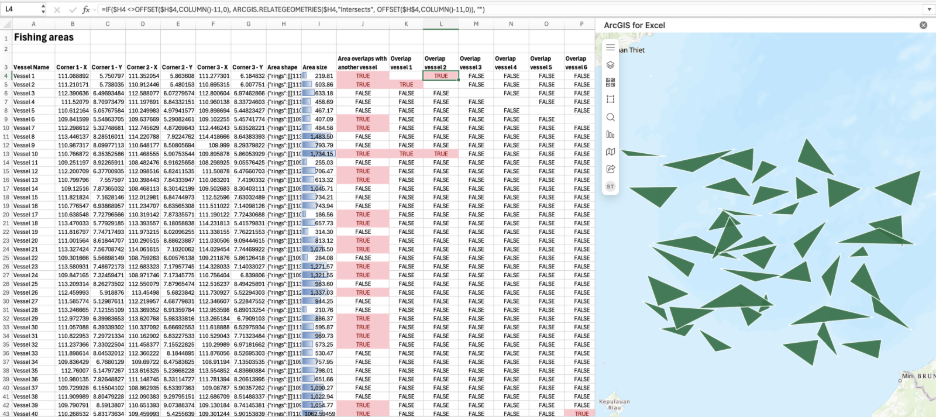
Result: Analysts can calculate coverage, visualize each vessel’s assigned zone, and flag overlapping areas that may require follow-up review.
Conclusion
These scenarios show how ArcGIS for Excel can turn JSON-based geometry data into actionable map layers without leaving the spreadsheet. By generating EsriJSON from addresses or coordinates, importing GeoJSON files, styling features by attributes, and calculating spatial relationships, users and students can support a wide range of mapping, analysis, and workflows directly in Excel.
