I have points that are given a primary category field and secondary category field of the same domain. I am attempting to use a pie chart to display the total count of points per category from both fields. I am trying to create a data expression to sum the count of categories from both fields:
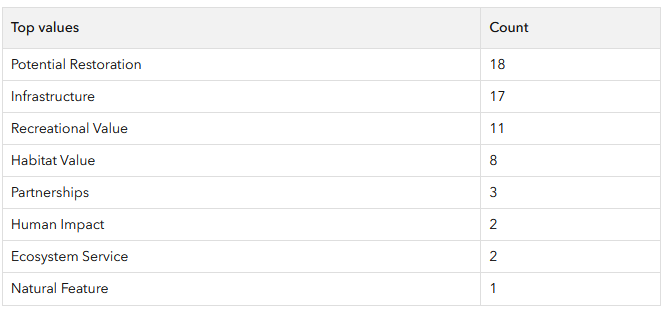
'Comment_Type'
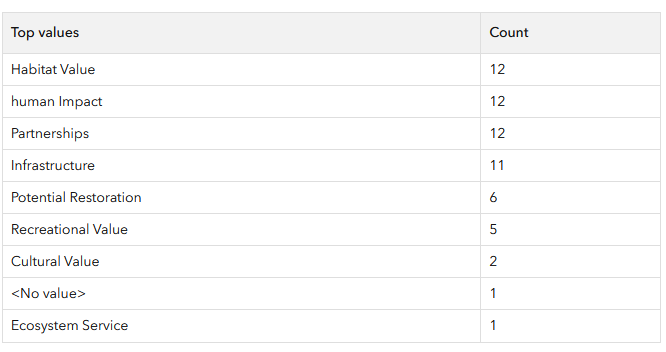
'Secondary_Type'
var itemId = 'xxxxxxxxxxxxxxxxxxxxxxxxxxxxxxxxxxx'
var fs = FeatureSetByPortalItem(Portal(p), itemId, 0, ['*'], false)
var comment_stats = GroupBy(fs, ['Comment_Type'],
[ { name: 'Comment_Type',
expression: 'Comment_Type',
statistic: 'COUNT' },
{ name: 'Secondary_Type',
expression: 'Secondary_Type',
statistic: 'COUNT' },
])
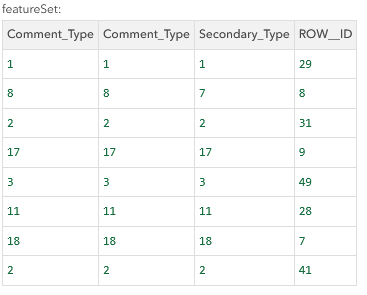
How do I get the table to use the domain label for the first column?
Why does the Secondary_Type column not match its actual values?
Is there a more efficient way of doing this?
var comment_totals = GroupBy(comment_stats, ['Comment_Type'],
[ { name: 'Totals',
expression: 'Comment_Type + Secondary_Type',
statistic: 'SUM' },
])
return comment_totals



