Hi Community,
I want to try and utilise the cartographic effects that ArcPro 3.5 has to symbolise my data without having to alter the underlying geometry.
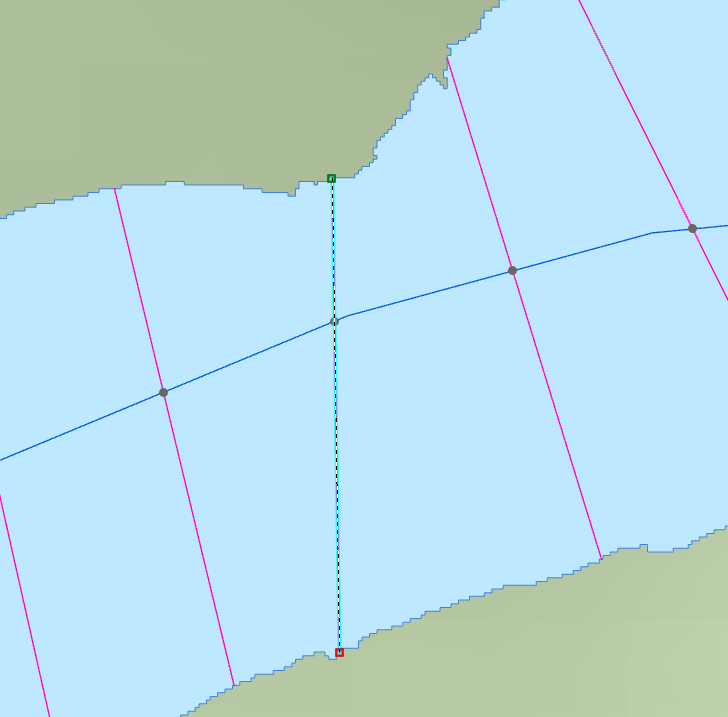
To set the scene, here is my data. The purple cross section lines are compose of two vertices and they always intersect the black point on the blue line, but note there is no vertex at that location. I show one line selected in edit mode to prove this.
I want to use one of the many cool symbol effects that ArcPro has to create a two colour line, say going from red to blue changing colour at that black point, something like below.
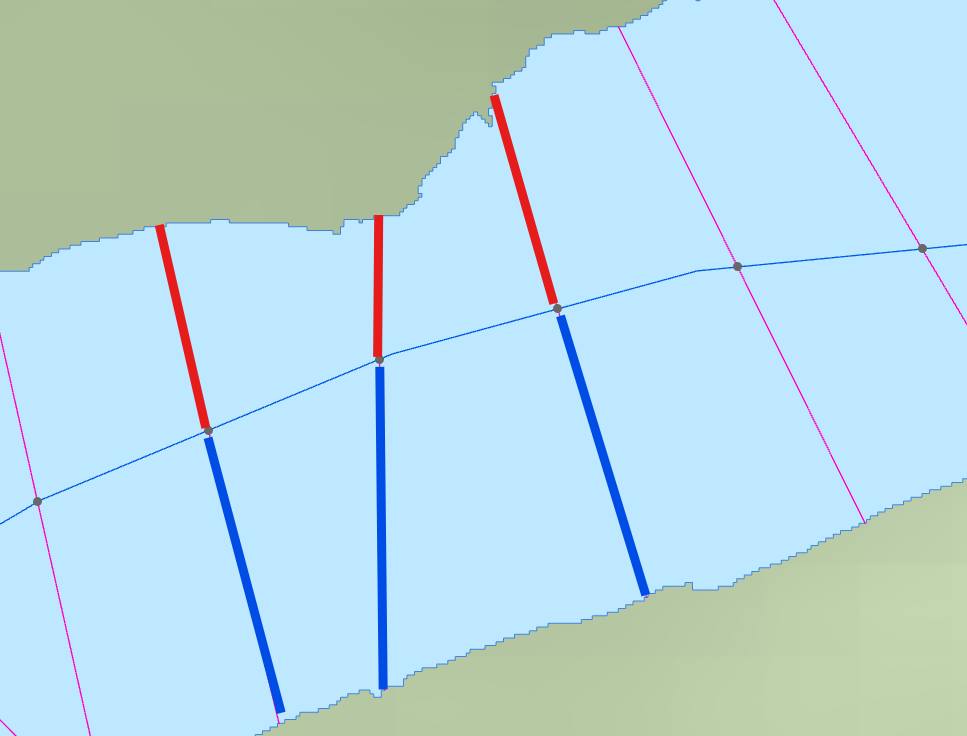
Now one approach, because I know no better, is to actually split the line at the black point and colour up individually, but I don't want to do that, I want my line whole, composed of only two vertices intersecting the black point.
Encoded into each line is the percentage along the line the black point is, its always from left to right.
Having spent hours looking at the help file, which is poorly documented and I even tried the new AI assistant I have been unable to achieve the effect I desire. I've explored the cut effect and the suppress effect. The suppress effect requires control points but I don't want additional vertices in the lines.
The cut effect seems to alter the appearance as one zooms in/out and its units (pt) I cannot seem to associate with the black points position even though I have turned on symbol property connection.
I thought this would be a relatively simple symbology effect but I have failed completely to achieve it! May be I am barking up the wrong tree with my choice of symbol effect? Or this is an effect that is not supported? May be there is some other crafty way of doing this?
Can anyone help?
Tagging carto guru : @JohnNelsonEsri