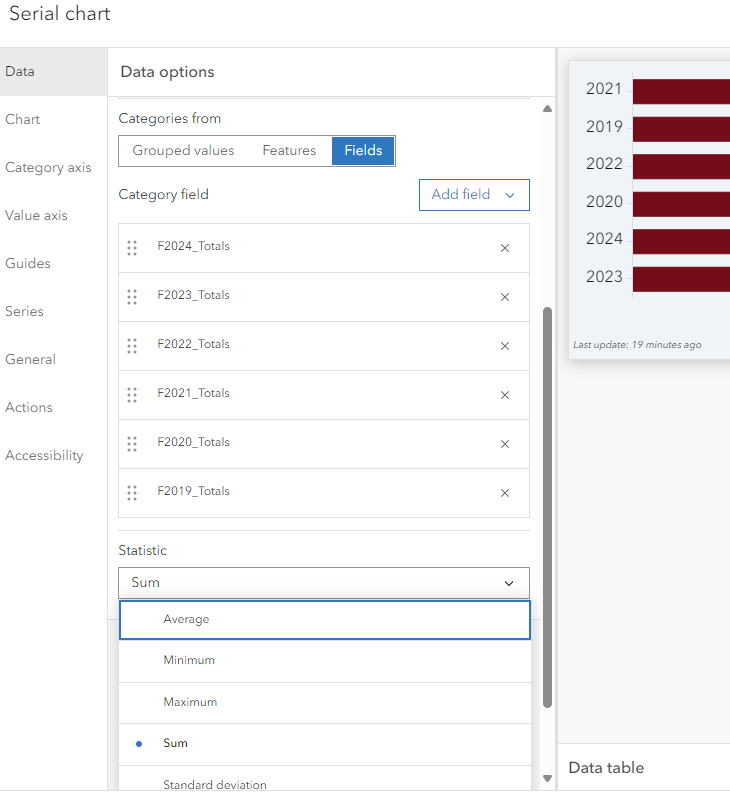
I recently updated the data for a dashboard I created in ArcGIS Enterprise and noticed that the years on my graphs are no longer in order. To create the graphs, I used the Categories From Fields option to manually select the columns I needed. I can rearrange the order while I am editing the dashboard and it looks correct there but the graphs don't change appropriately and there is not an option to sort by. Before our recent Enterprise update, this was not a problem.
I'm also having this issue after updating my Portal. I'm using version 11.5 of the portal and 4.32.0 of Dashboards. It sorts the way it wants. Interestingly, changing the statistic type changes the order, but nothing that seems logical.
Hi, I can recreate your issue in Enterprise 11.4. What version of Enterprise are you using?
It works as expected in ArcGIS Online. There, rearranging the order of the fields in the configuration view, updates the order of the fields in the chart.
I think you should report this as a bug to Technical Support.
Signed in members can post, follow updates, and more. New here? Register a free account.
Find useful guides, FAQs, and documents to help you navigate and make the most of Esri Community.