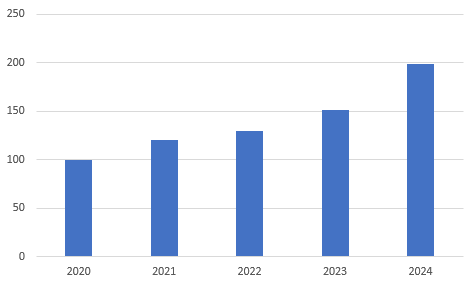
I'm trying to come up with a data expression to create a bar graph to simply show the count (number of records) within 5 different data layers. The layers represent the same type of data, just range from records from 2020-2024.
I'd like to end up with something like this:
Thanks for any guidance!


