I am trying to figure out how to make the Histogram Chart option within Experience Builder be able to trigger the corresponding map data to be filtered based on your selection within the histogram. This type of trigger action seems to work on most other Chart types I have tried out, but I cannot figure out how to get it work for Histograms.
I have the histogram created and it looks great, but the only options on the trigger values are "OBJECTID", "Min value", "Max Value", or "Count" (so just the pure values displayed on the Histogram):
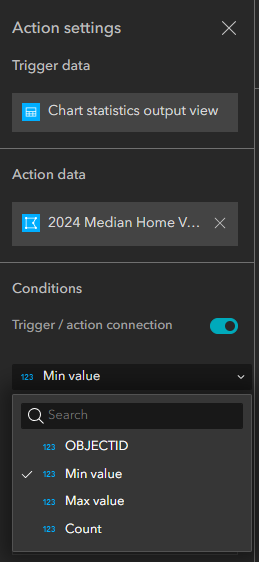
These obviously don't directly correspond to values within the data on the map, since they are aggregated to make the histogram.
I was hoping to recreate an action similar to how Histogram charts work on ArcGIS Pro, where your selection is reflected on the map, but I cannot seem to find a way to configure the Experience Builder Chart Action settings to work for this Chart type.
Does anyone know how to get this to work?
Thank you!


