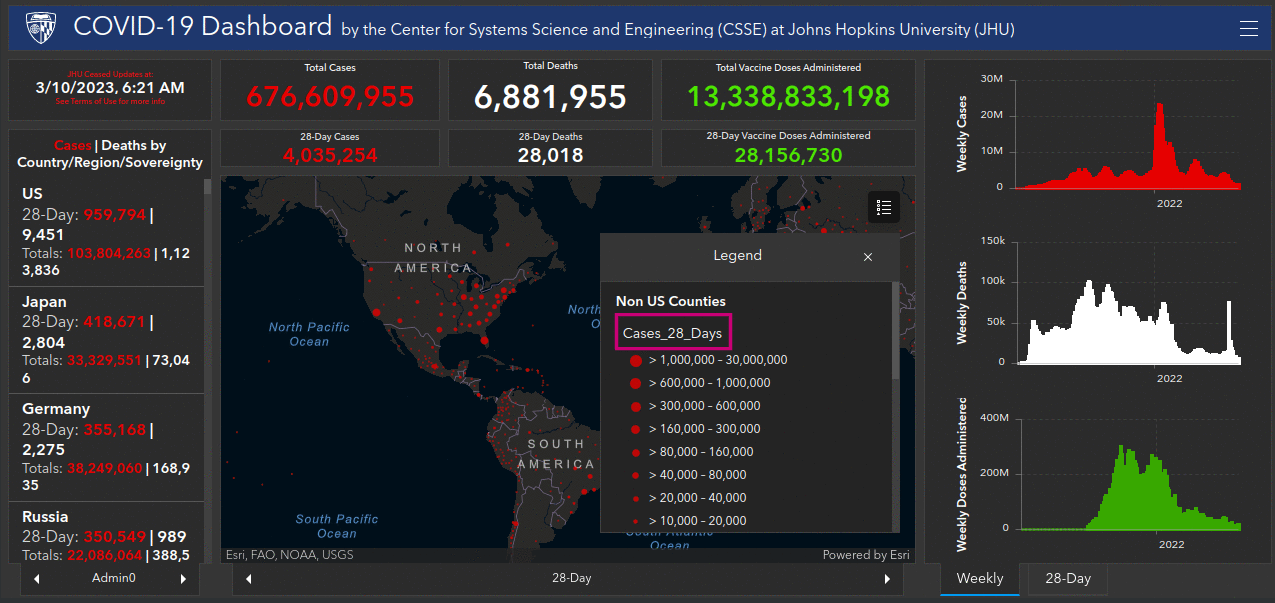
I'm working with a dashboard and trying to find a way to modify or hide the displayed field names from the attribute table in the legend. The webmap I'm using includes several sublayers and some of the field names are not user-friendly.
Specifically, I want to change or hide a field named "Cases_28_days" to something like "Cases: 28 Days", or hide it completely. For reference, the issue is visible on this COVID dashboard (see screenshot below to where legend is opened in the map) where the field/column names from the attribute table are displayed in the legend.
Has anyone encountered this and found a solution?
Example taken from the example dashboard gallery at https://www.arcgis.com/apps/dashboards/bda7594740fd40299423467b48e9ecf6