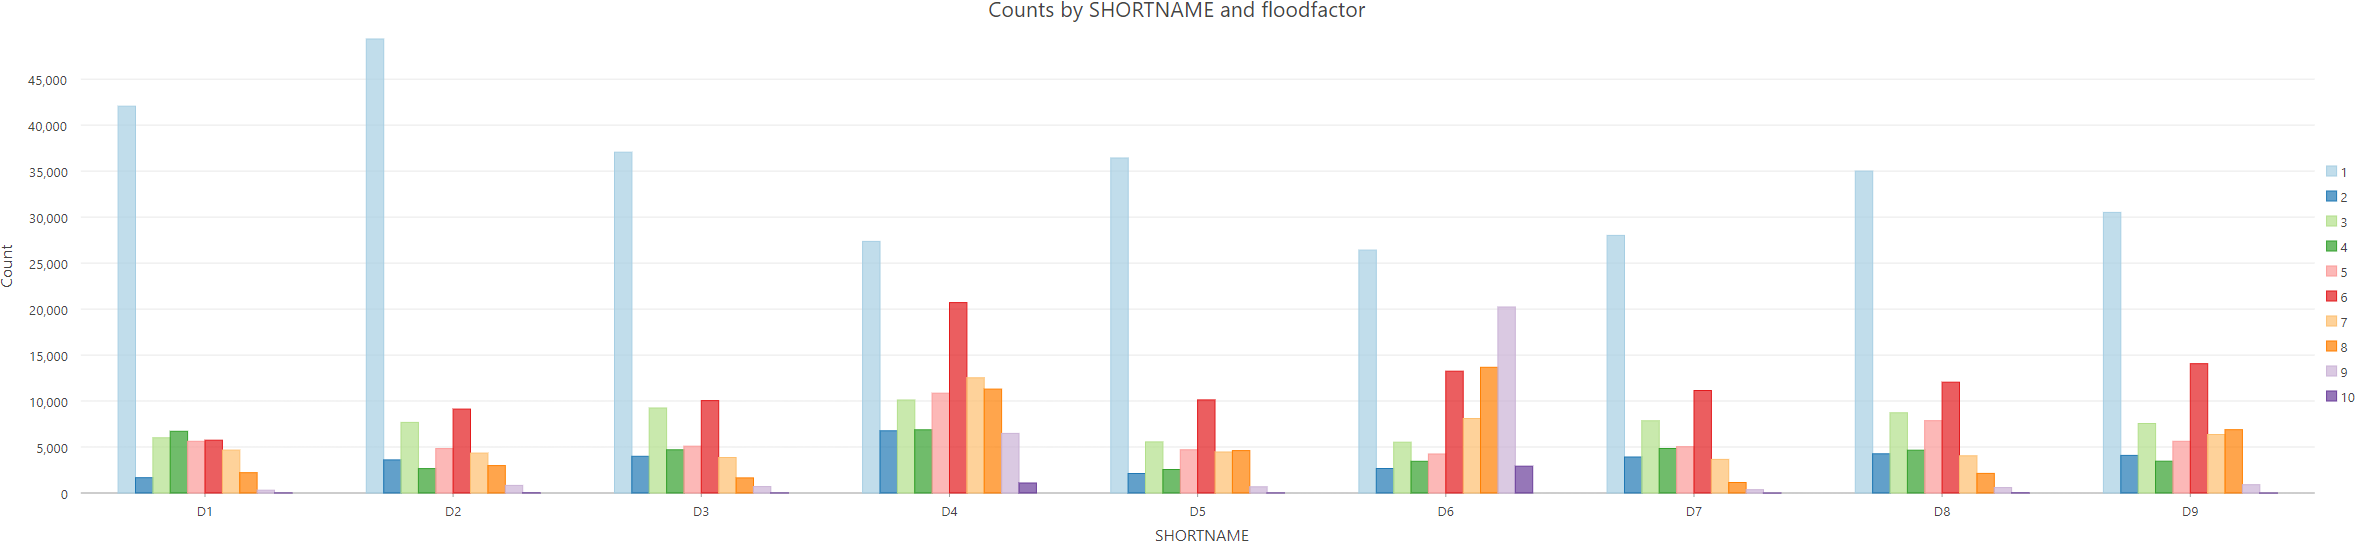
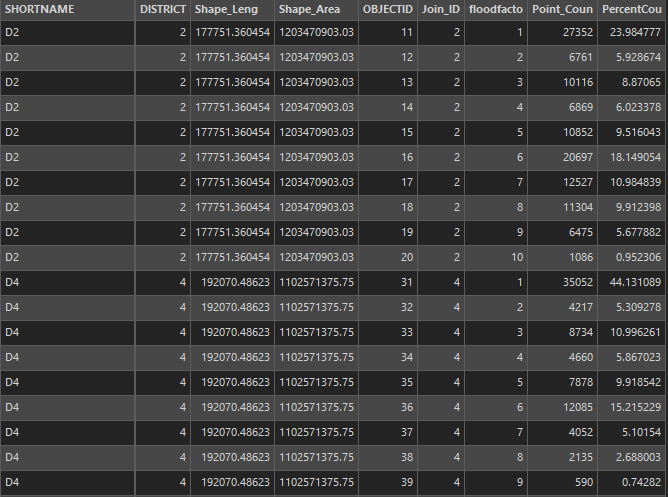
Based on the sample data below, is it possible to create the following plot without selecting a statistic?
- x-axis = SHORTNAME
- y-axis = Point_Coun (this is why I don't need to select a statistic)
- Subgroup = floodfactor
Desired output (Even though this still doesn't show percentage which I am trying to figure out it ArcGIS Pro):