I can't seem to generate an appropriate raster function template to visualize an 8-bit raster with a Min-Max stretch from 0 to 1 with a color ramp.
I have a collection of 8-bit unsigned rasters that contain only 0 and 1 values (and NoData) that are destined for an image service. I want to generate a raster function template to symbolize the rasters so that 0 values are a 50% transparent white and 1 values are blue. This has proven unbelievably difficult, even though it's very easy to apply such a symbology directly in ArcGIS Pro.
What I want to replicate is this fairly simple Stretch setting:
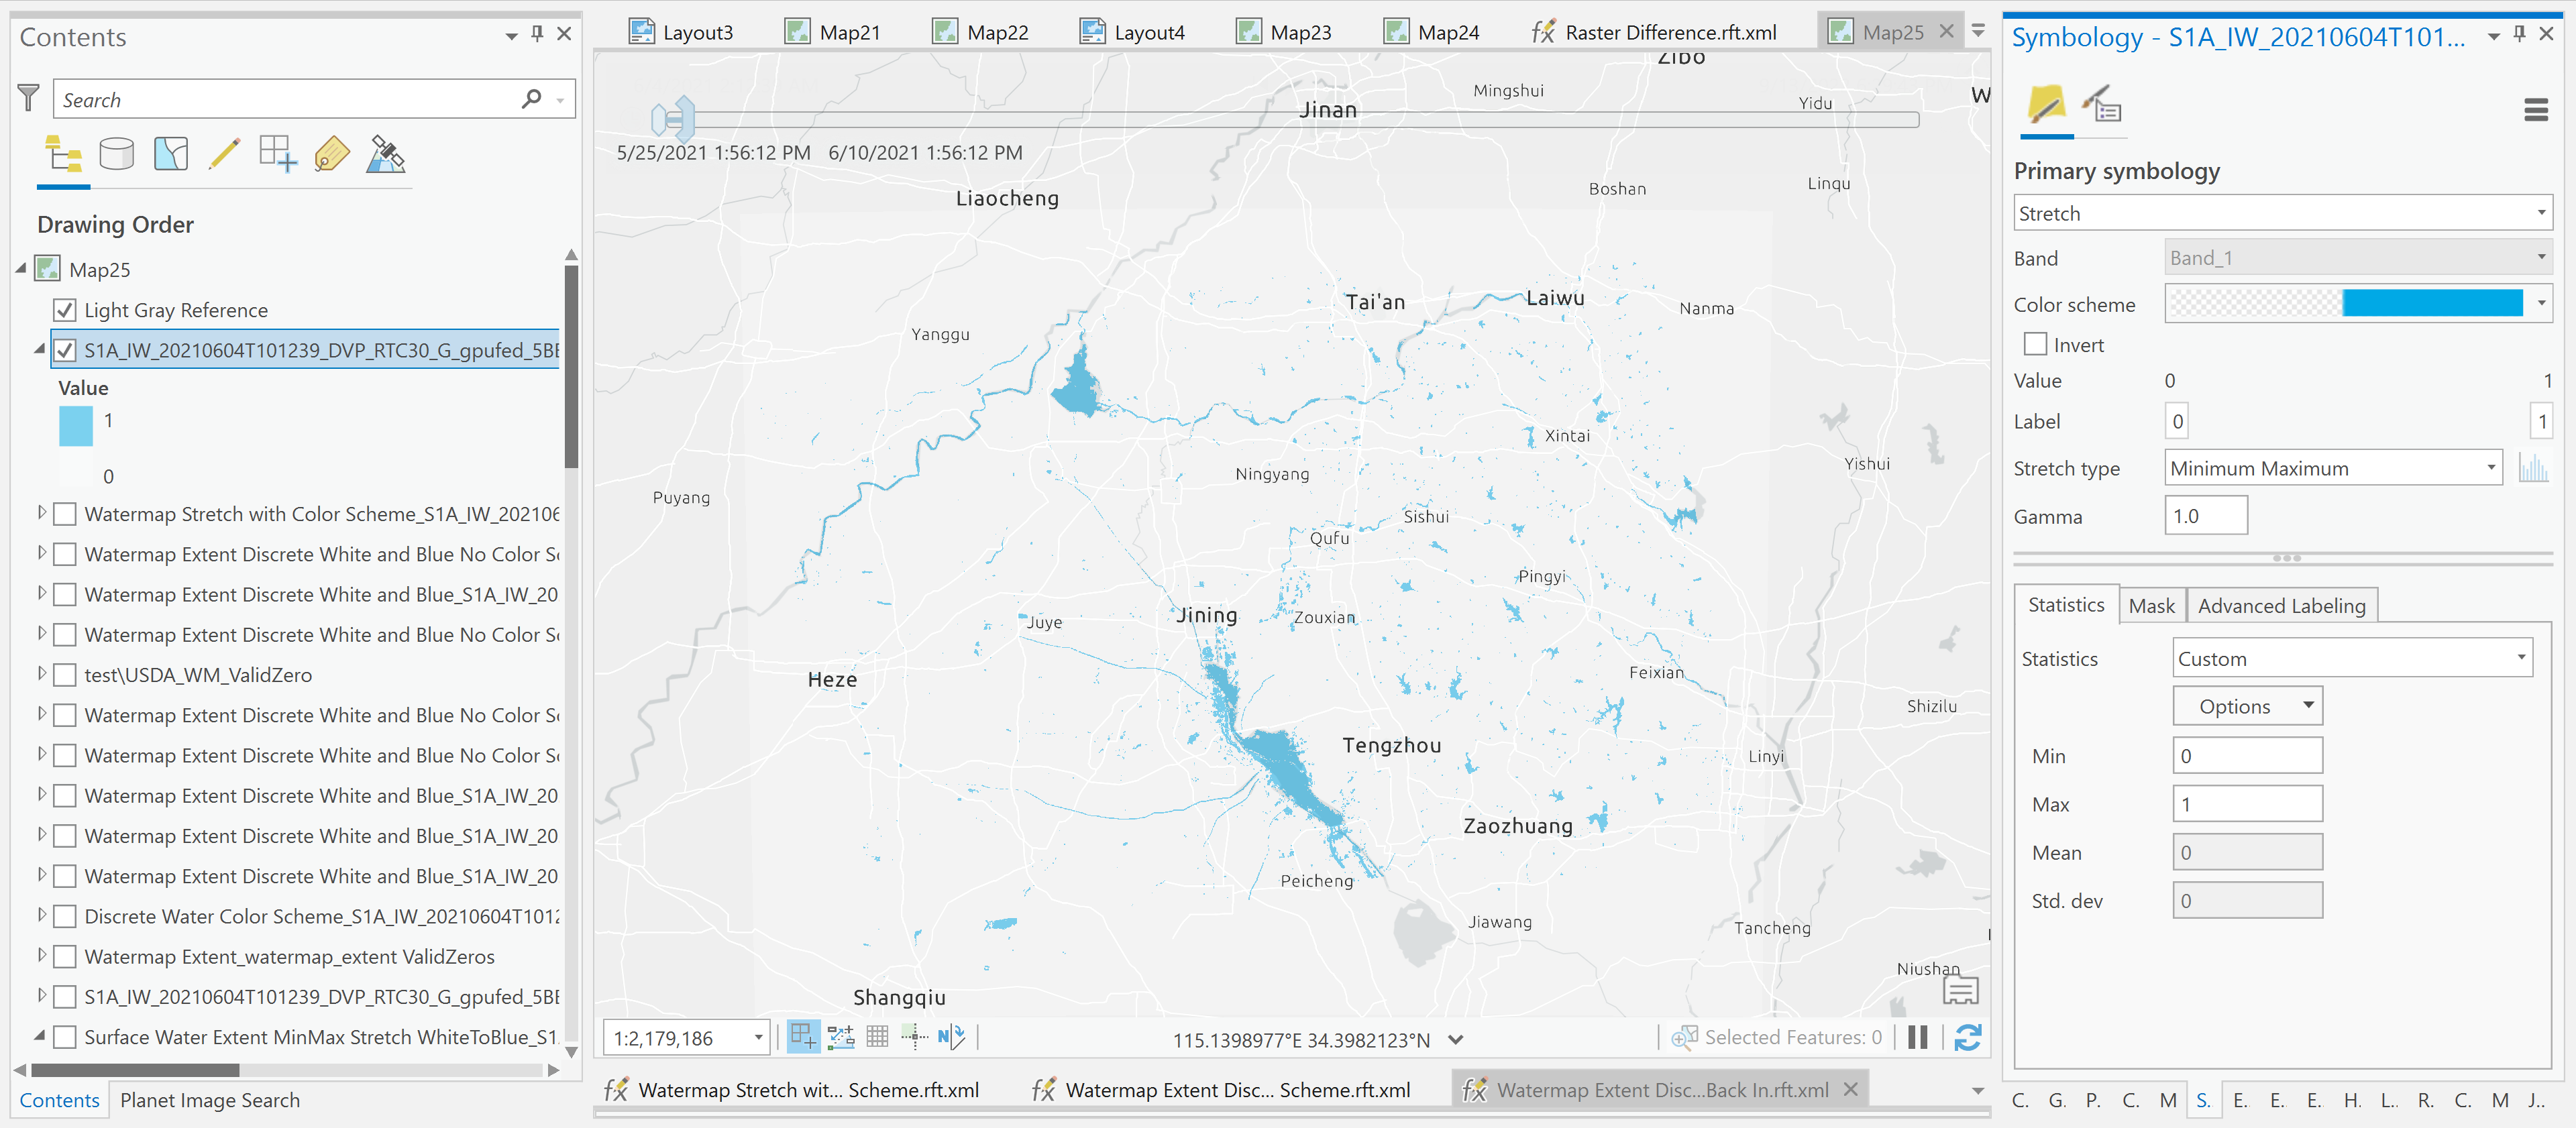
There's a Min-Max stretch applied, from 0 to 1 (using Custom stats). I've generated a custom discrete multipart color scheme where the low values (encompassing 0) have a 50% transparent white applied, and high values (encompassing 1) are blue.
If you simply save this symbology as a Raster Function Template, it saves as a "Rendered Raster" function. This then displays as an RGB image, with no transparency on the white pixels, rather than a stretched raster with values from 0 to 1.
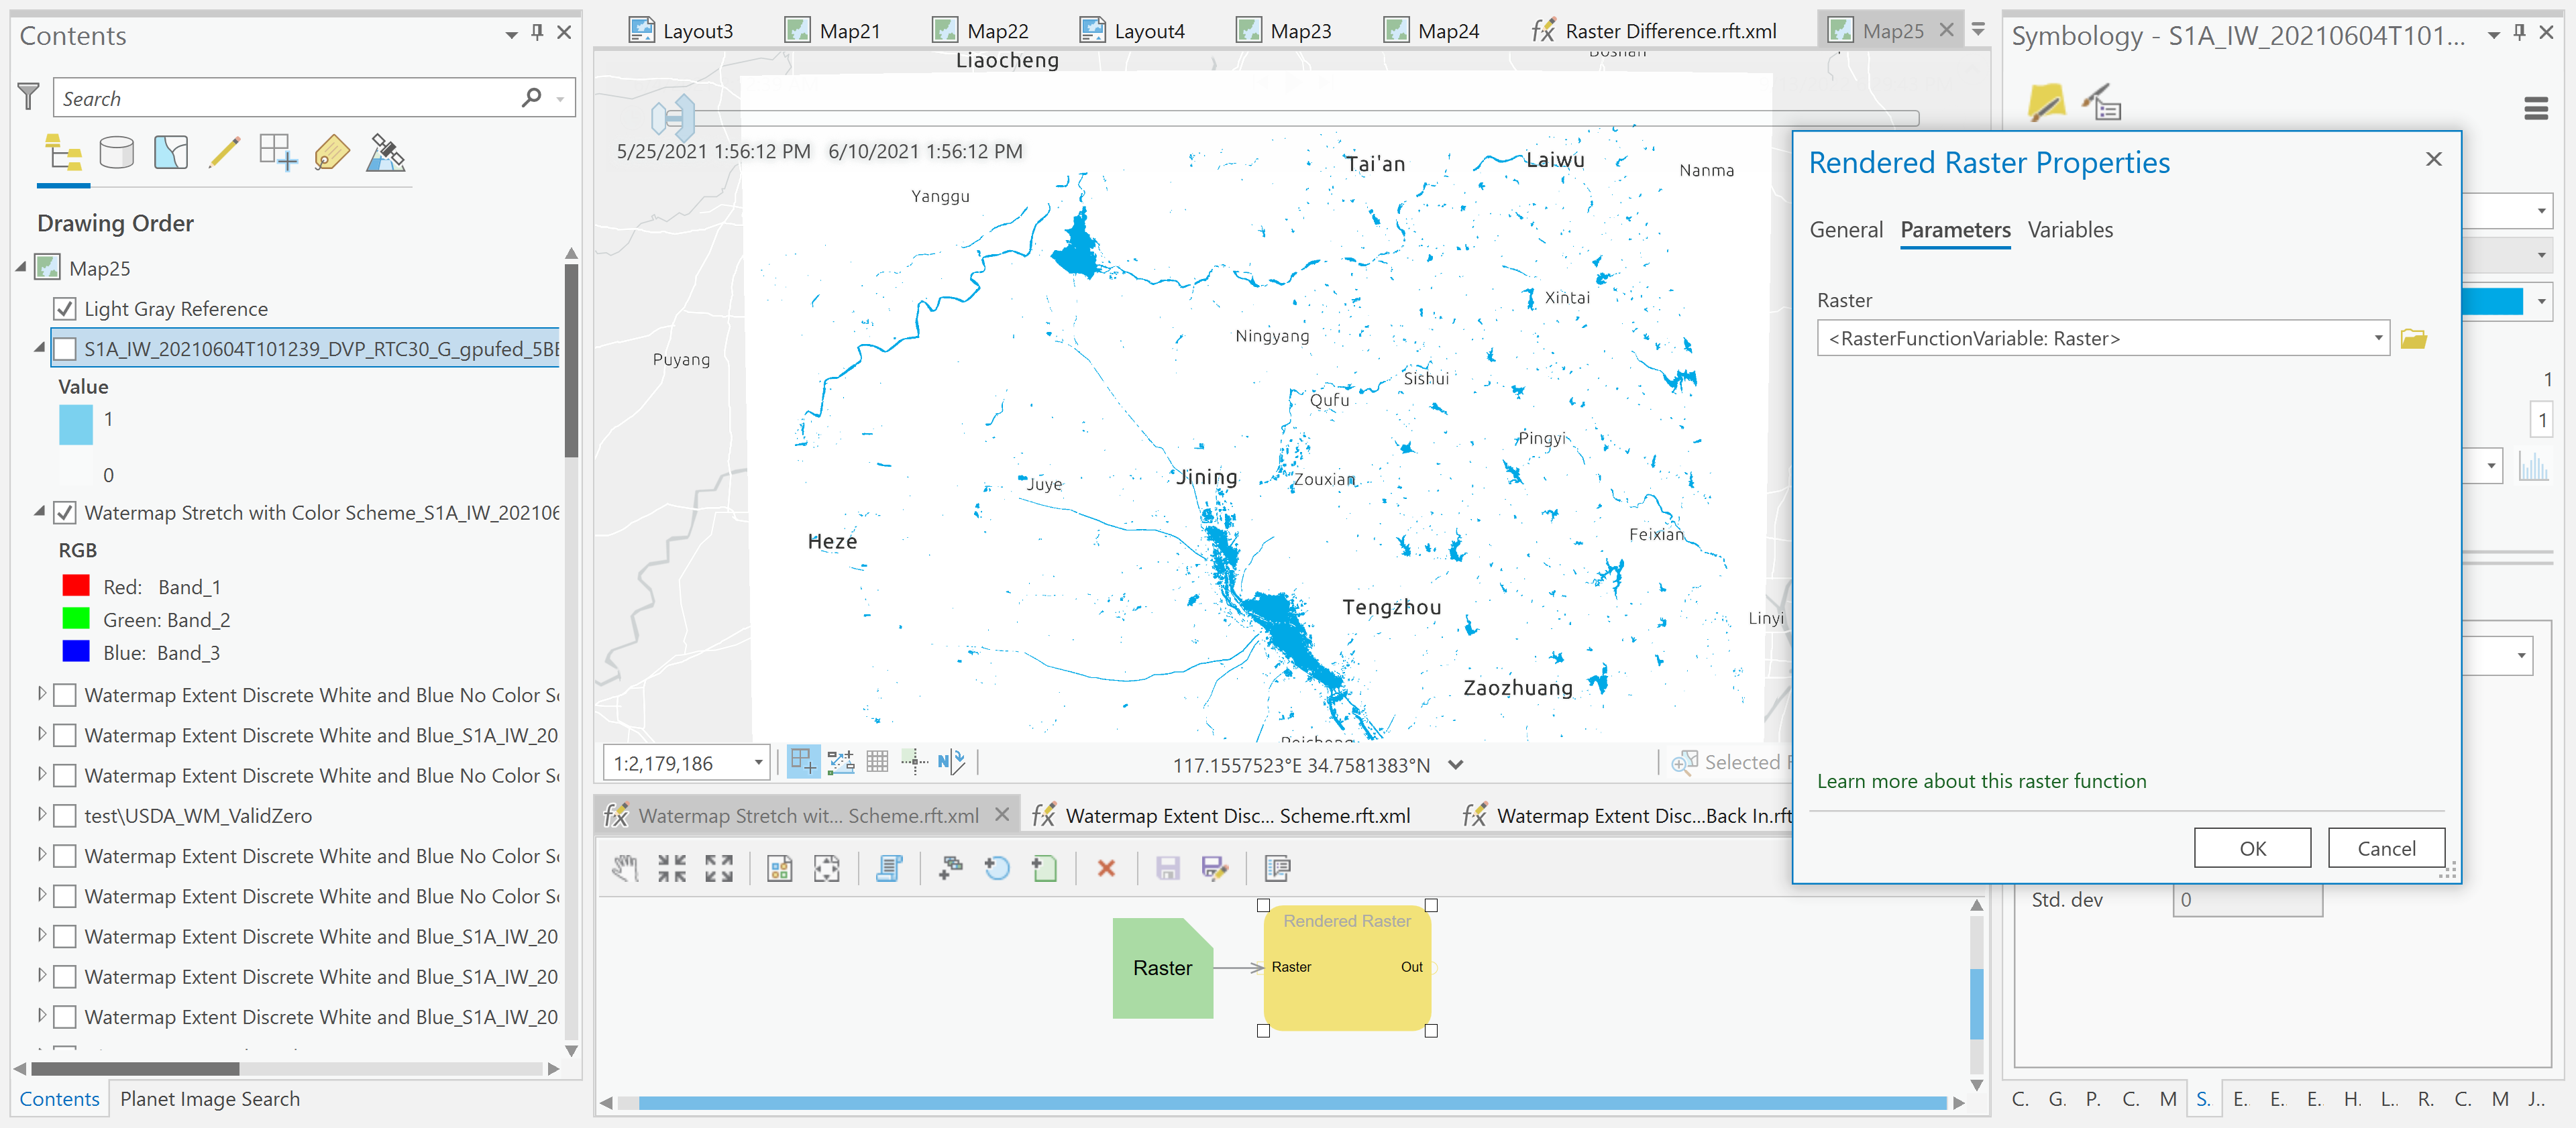
There are no settings listed in the parameters; it's completely opaque what sort of rendering is being applied to this raster. The legend simply displays the RGB bands, rather than a color bar with the stretched Min-Max values.
My first thought was to just build a raster function template using first a Stretch function followed by a Colormap function. I tested each component, and if I just apply the Stretch function I can get the basic behavior I want, just in black and white:
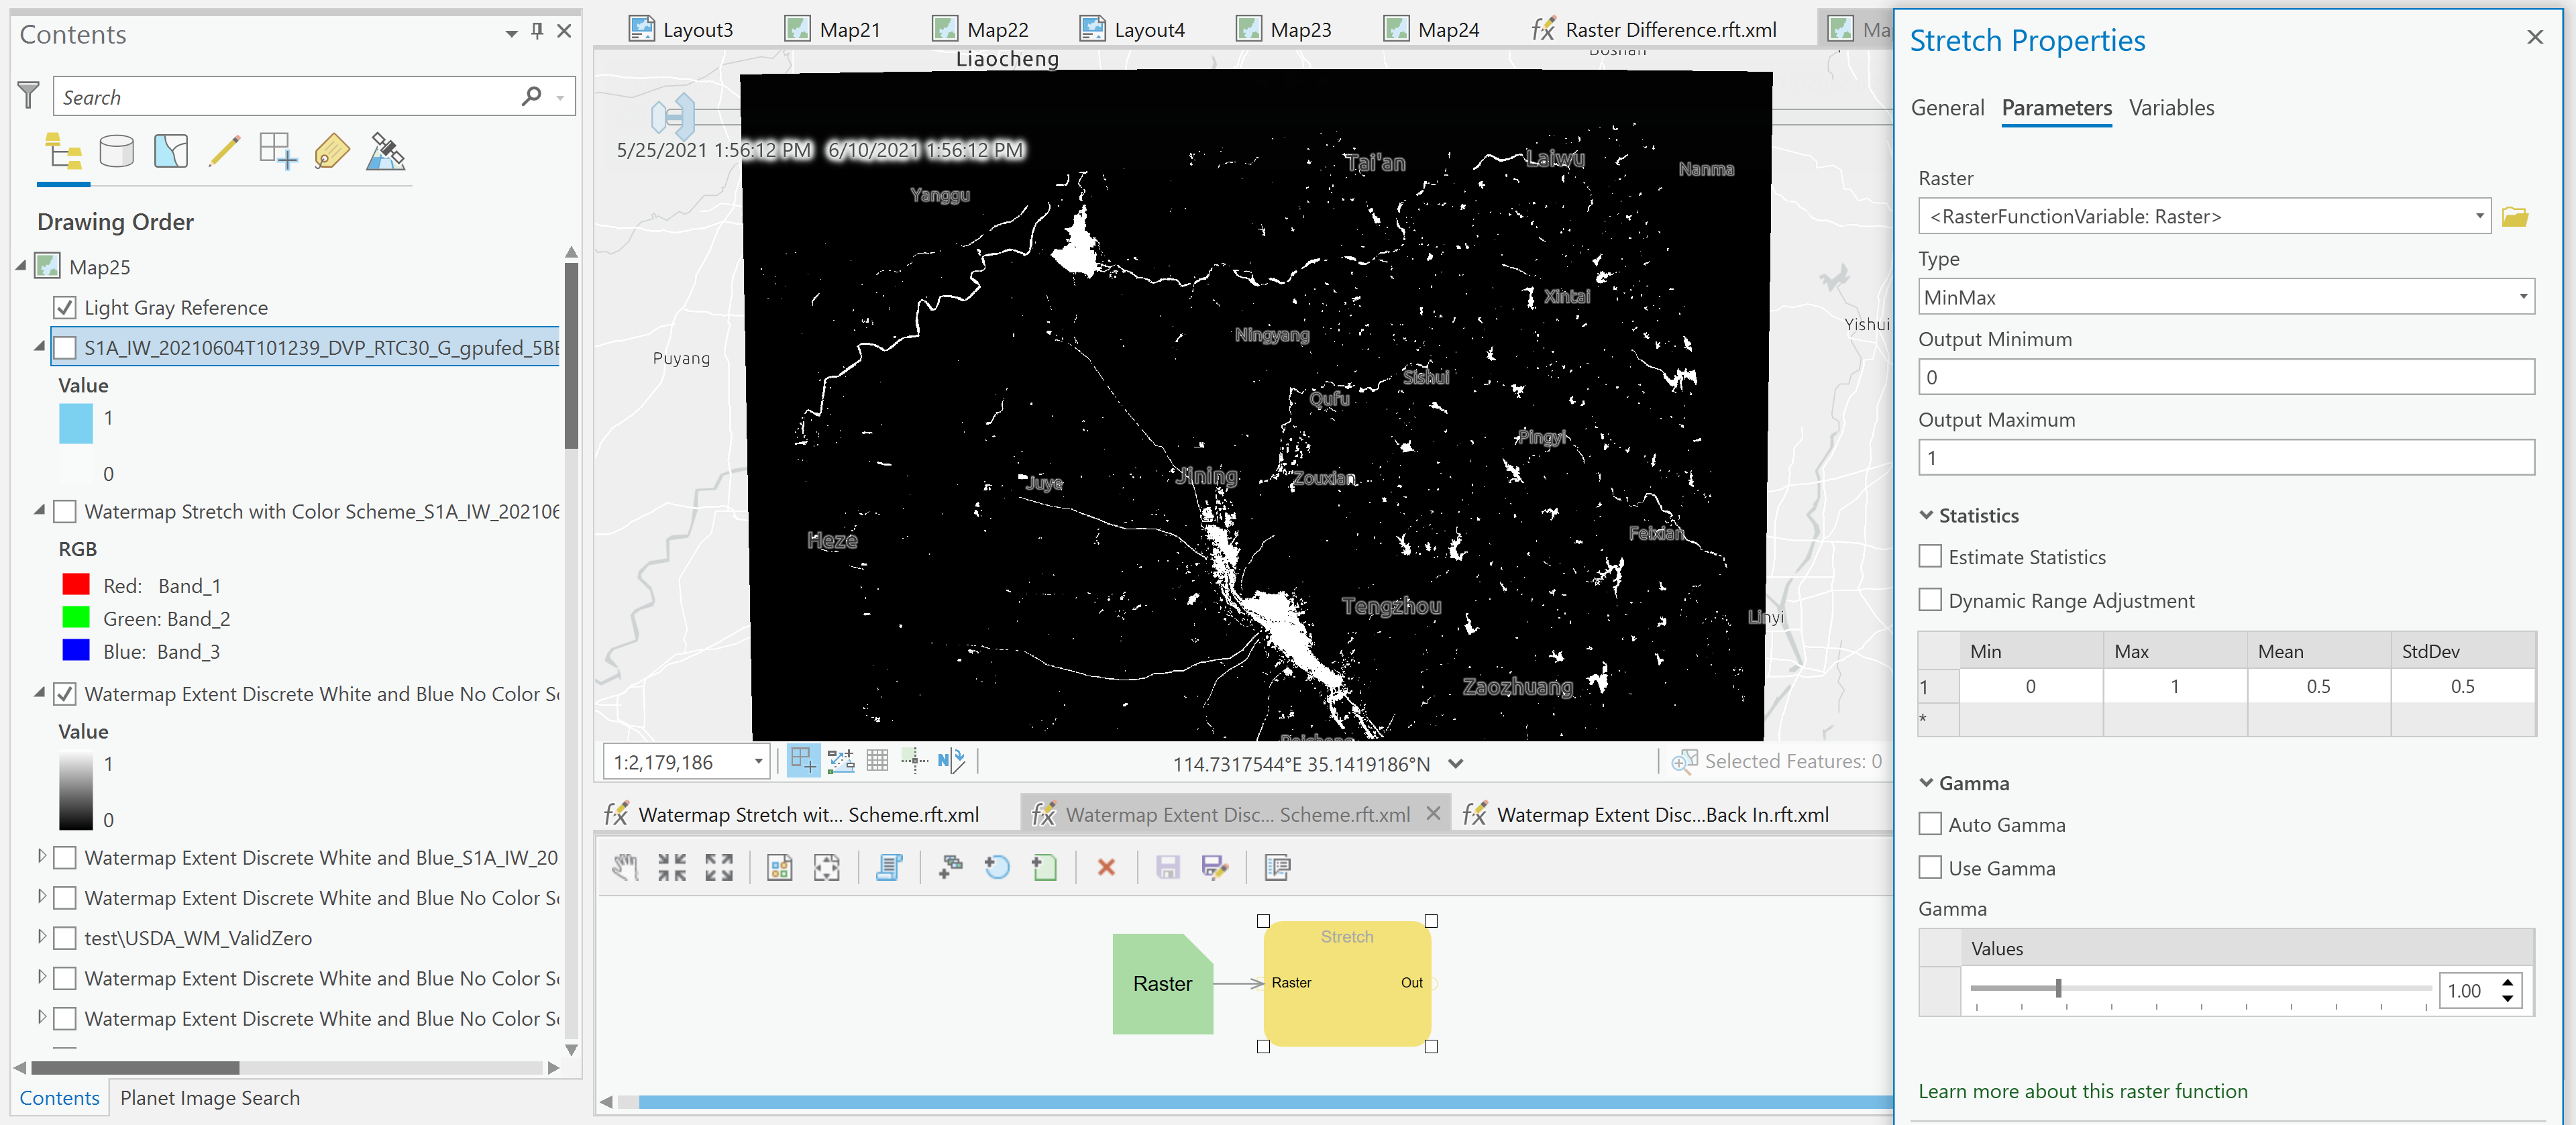
It seems like I should be able to simply add the Colormap function to apply my custom color scheme, and the black-to-white color ramp would be replaced with my transparent white and blue color ramp. But when I do that, the scaling reverts to 0 to 255. As such, both 0 and 1 are in the transparent white region of the color ramp.
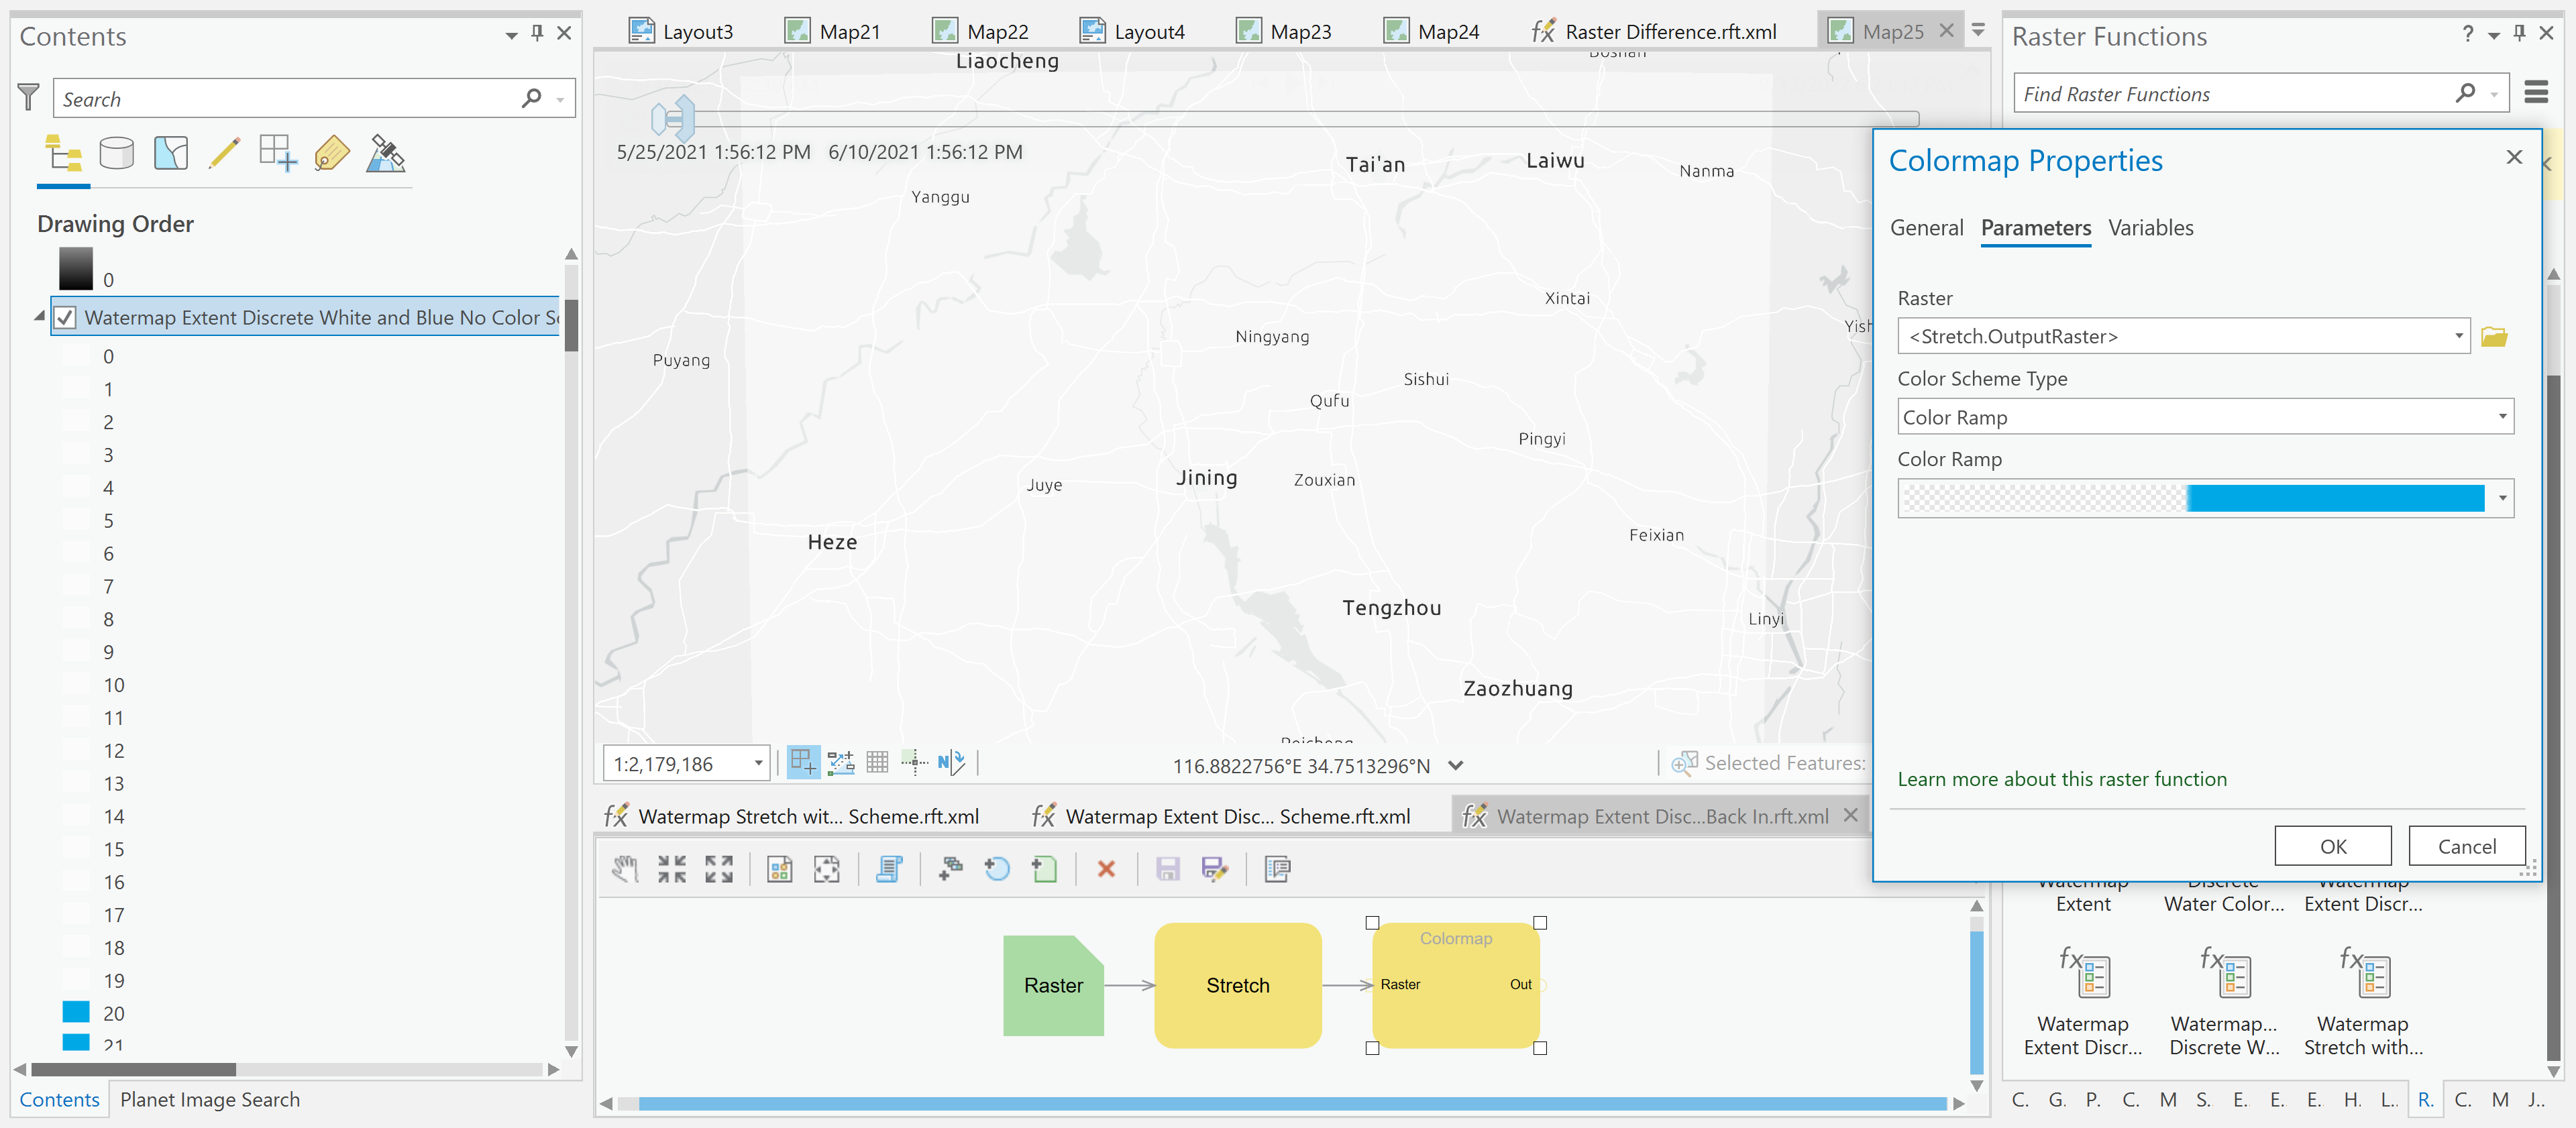
It also changes the legend display to a discrete display, where every number from 0 to 255 has a color patch, rather than just displaying the stretch colorbar. Incidentally, it only displays the transparent white from 0-19, the blue from 20-39, then displays a range of green to red colors for the remaining 40-255 (not sure what's driving that, seeing as I only set 2 colors in the multipart ramp settings).
I tried adjusting the color ramp so that 0 and 1 would have different colors, but it's pretty tricky because they're so close together in the scope of 0 to 255. And even so, the legend is unwieldy. I'd like to just see the colorbar like I do when I manually set the symbology.
I tried switching the order of the colorbar and stretch functions, but that wasn't helpful.
I also tried exporting a Classified Symbology setup as a RFT, but again, it just saves that symbology as a Rendered Raster setting, so it's just an RGB output, with no transparency capabilities or legend.
Any ideas?



