I've been trying to symbolize a mosaic dataset using a colormap for a couple days with no luck. I finally found this workflow to help me out: https://support.esri.com/en/technical-article/000021676. However at the step below I have no way of changing the symbology to unique values for the raster function to work. I only have stretch, discrete, and vector field.
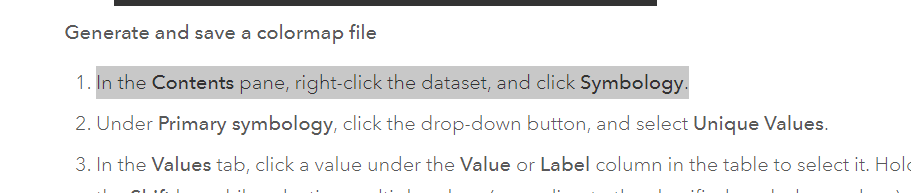
Very frustrating process. Every workflow I've found so far is a dead end leaving me with an RGB symbology.
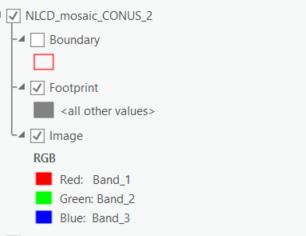
The intended final product is a time series showing changes in land cover but it's not useful if I can't show the appropriate land use symbology. Thanks for any help.
