Hello all,
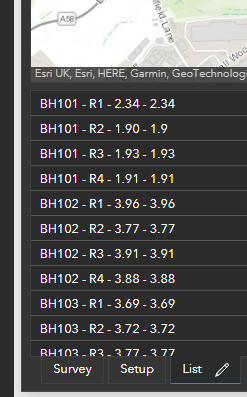
I am trying to summarise some data from multiple borehole surveys. Each borehole is visited up to 6 times, and each time a new record is submitted via Survey123. The depth to water is recorded on each visit. I would like a simple table, or indicator that shows this in a dashboard, so it looks something like this:
| Depth to Water |
| Borehole | Visit1 (R1) | Visit2 (R2) | Visit3 (R3) | Visit4 (R4) | Visit5 (R5) | Visit6 (R6) | Min | Max |
| BH101 | 2.6 | 2.4 | 3.2 | 2.5 | 3.2 | 2.9 | 2.4 | 3.2 |
| BH102 | 1.8 | 1.6 | 1.6 | 1.3 | 1.9 | 1.5 | 1.3 | 1.8 |
At the moment I can only get the Dashboard to show each visit as a new line in either the table or list. Is it possible to show this data summarised, so that just 1 line exists for each borehole? And then show the different depths recorded, and use an expression to highlight/pull out the min/max?
Thank you,
Ben