Arc Hydro v10.8.0.34, ArcGIS Desktop v10.8.1 (both 32 bit)
My flow accumulation grid (fac) is not being created correctly. For some reason, the flow direction grid (fdr) has the north east direction as -128 instead of +128 as I assume it should be.
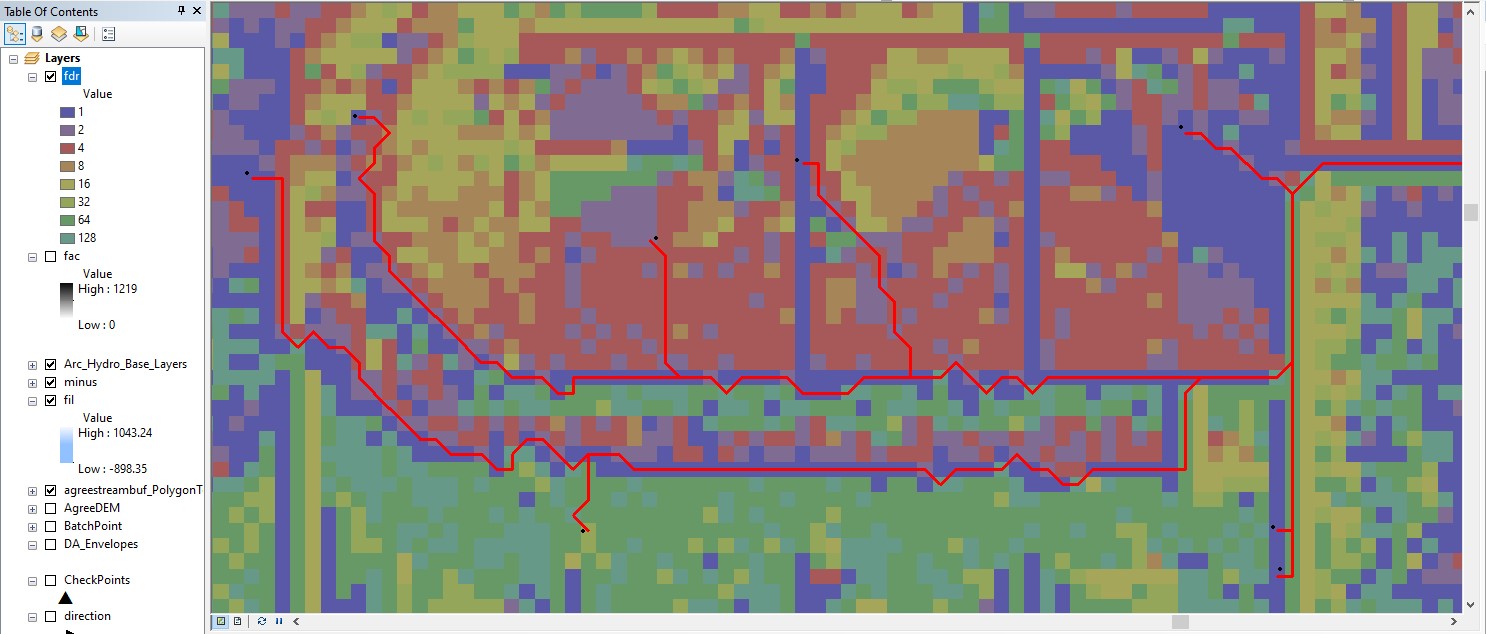
The first image shows the fdr grid and some flow path tracing lines. These are correct event thought the value of the fdr grid is -128. This may not be an issue, but all the examples have 128 instead of -128. I have deleted and repeated the creation of the fdr grid using SA and Arc Hydro tools.
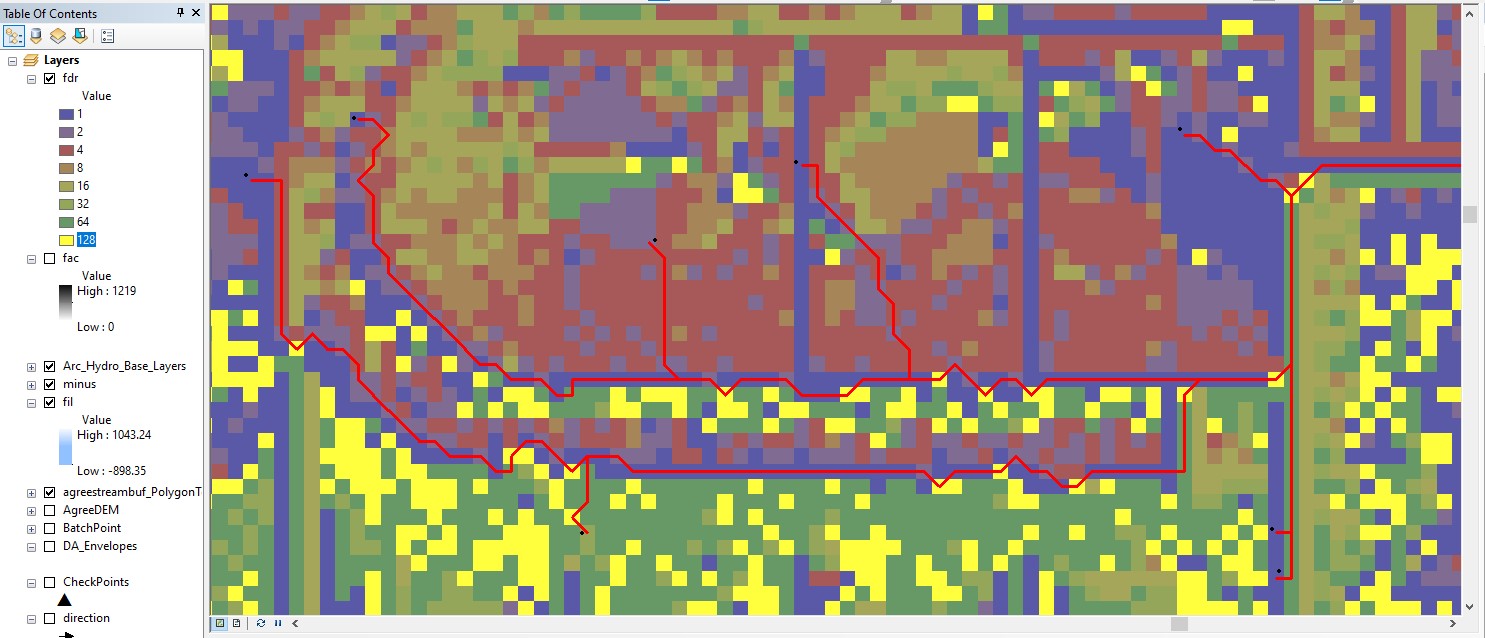
In the second image, I show the fdr with the 128 valued cells in yellow to highlight them. They are 128 in the table of contents, but using the i tool they show as -128.
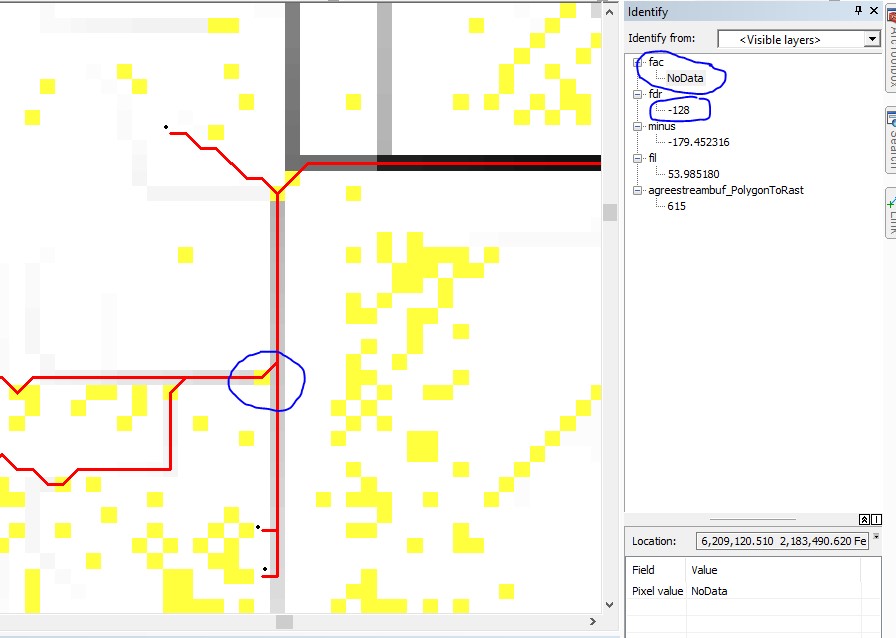
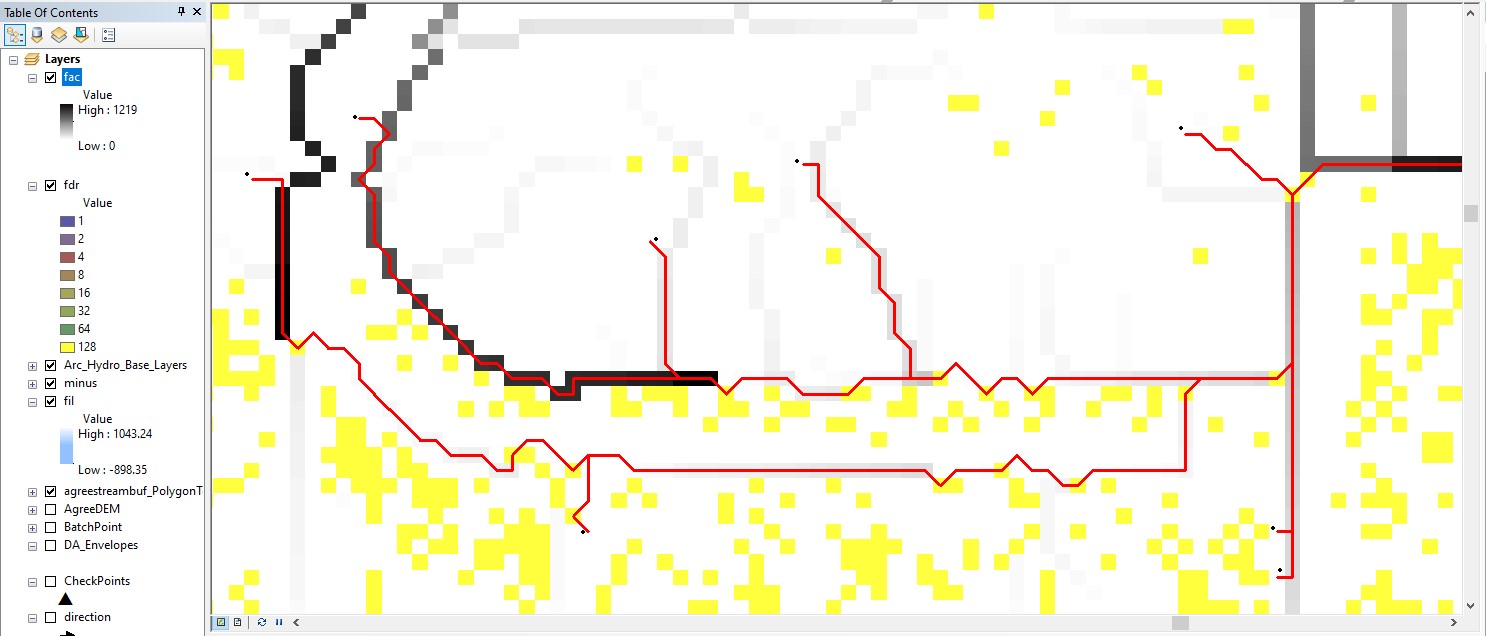
In the third image, I show the flow accumulation grid (fac) turned on over the fdr grid. You see the yellow cells “showing through” b/c the fac grid shows NoData. When this happens the flow accumulation starts over. It should continue and the cells should get darker along the flow direction (having higher and higher accumulation).
The forth image is a portion of the third image showing the identify tool results on the right and the yellow cell that was selected circled with a blue line as well as the results circled on the right.
My expectation was that the fdr value would be a positive 128, and the fac would be ever increasing.
The resulting fdr grid is a "signed integer" which means it can have +/- values. A search confirms that in an 8 bit system 8-BIT UNSIGNED: 0 to 256 8-BIT SIGNED: -128 to 127. So, in an 8 bit signed integer raster, there can be no +128 which would make the "D8" flow direction type, it would make sense to use -128 for a signed integer grid (and the flow path tracing tool works with it). In an older "successful" hydrology effort the fdr grid was an unsigned grid. It is not being created as a signed grid.
Can anyone shed light on why this is happening?
Thanks,
Mark
First Image - fdr grid and some flow path tracing lines.
Second Image - fdr with the 128 valued cells in yellow to highlight them.
Third Image - fac turned on over the fdr grid. Yellow 128 direction grids from fdr show through where fac is NoData.
Fourth Image - portion of third image showing results of the identify tool click on circled grid cell.