Hello,
I'm hoping someone can help me with one aspect of my master's dissertation. I'm investigating the spatial distribution of illegal activity (poaching, logging, encroachment, etc.) occurrence in a Nigerian forest reserve. I want to establish a risk model based on the following assumptions:
Variable | Criteria | Risk Outcome |
Forest cover | If forest cover = low | 0 |
If forest cover = moderate | 1 |
If forest cover = high | 2 |
River | If nearest river > 2km | 0 |
If nearest river ≤ 2km | 1 |
Road | If nearest road > 2km | 0 |
If nearest road ≤ 2km | 1 |
Community | If nearest community > 2km | 0 |
If nearest community ≤ 2km | 1 |
Ranger post | If ranger post ≤ 4km | 0 |
If ranger post > 4km | 1 |
where the sum of risk outcomes is equal to a total risk value for a given point on the map.
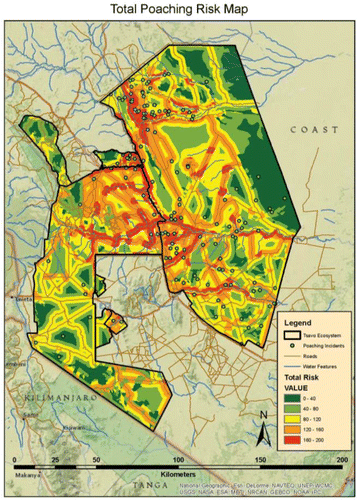
My overall goal is to create something like this:
I'm learning QGIS for the first time so have been having trouble with some methods. So far, I've tried using the semi-automatic classification plugin to classify forest cover into the three classes (low, moderate, high) but have run into a python error message each time. Now I've managed to get to this:
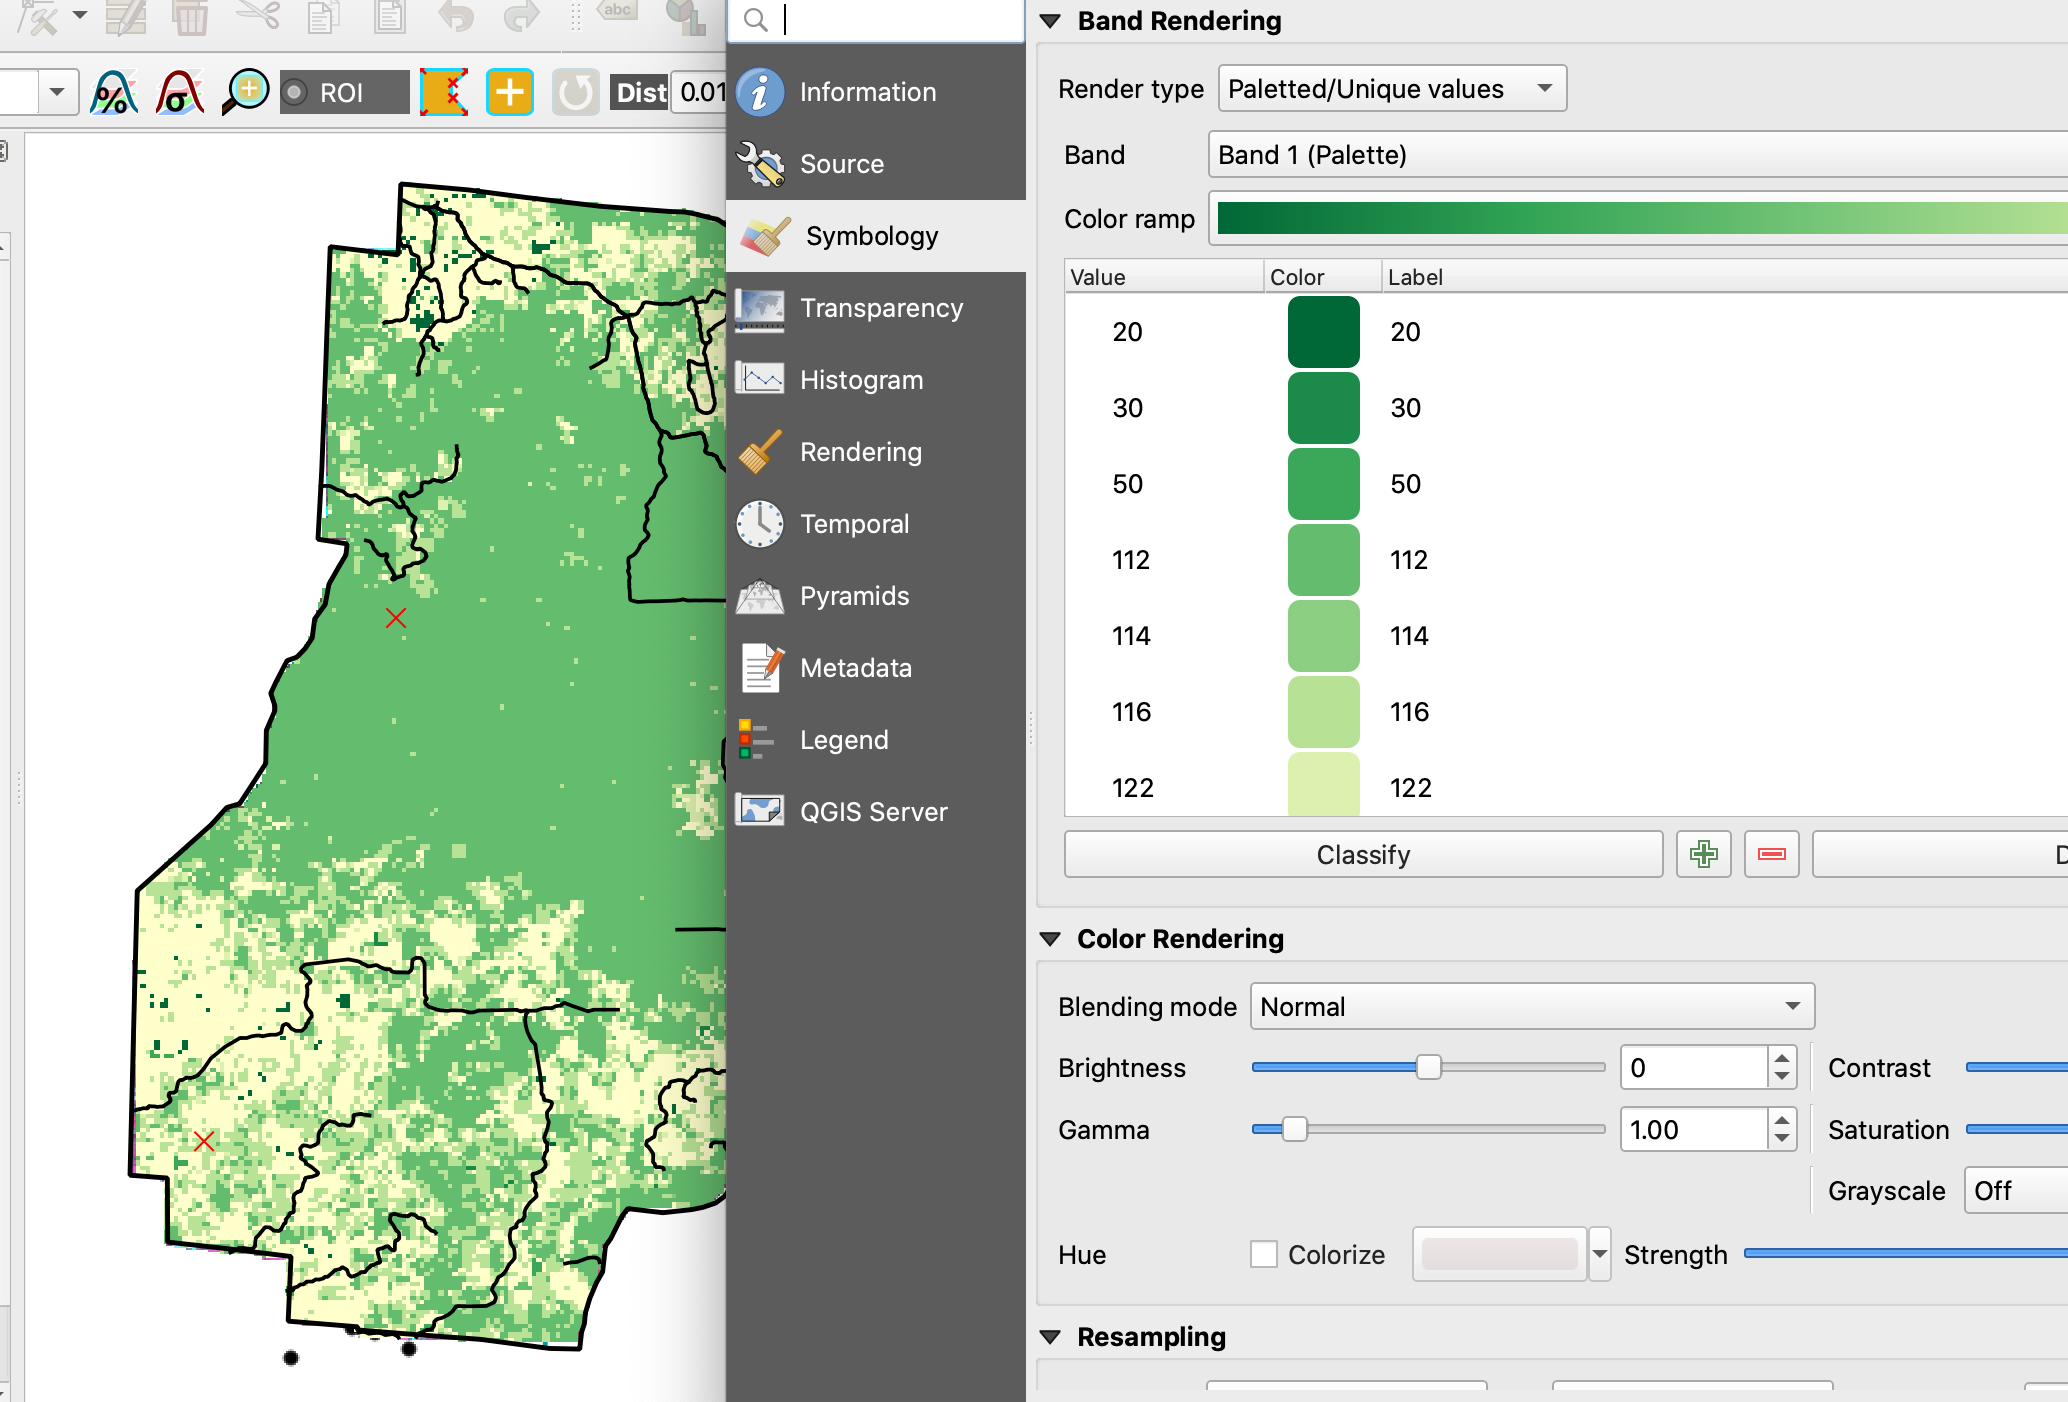
However, there is no attribute table and I'm unsure of what the symbology values represent.
My first question is: (a) how do I group these symbology values into three classes, and (b) is it possible to definitively classify pixels based on these values for use in a model?
Second: how can I approach establishing a risk model based on the assumptions I've outlined? Does anyone know of a plugin or user-friendly method where I can set specific risk values to each area?
I've managed to do buffers quite easily but realized it isn't helpful for what i want to do because there's a confusing amount of overlap. It also doesn't help for the forest cover classification anyway.
As I said, I'm quite new but have played around with a few methods and haven't had any luck. I'd really appreciate any advice at all!
Thank you in advance.