- Home
- :
- All Communities
- :
- Products
- :
- ArcGIS Viewer for Flex (Retired)
- :
- ArcGIS Viewer for Flex Questions
- :
- Chart widget, or roll my own solution?
- Subscribe to RSS Feed
- Mark Topic as New
- Mark Topic as Read
- Float this Topic for Current User
- Bookmark
- Subscribe
- Mute
- Printer Friendly Page
Chart widget, or roll my own solution?
- Mark as New
- Bookmark
- Subscribe
- Mute
- Subscribe to RSS Feed
- Permalink
- Report Inappropriate Content
Just wondering if the chart widget is man enough to allow me to create line graphs with lines for baseline, previous year and current year on the same graph or whether I am better off creating something from scratch. I have looked at the chart widget sample, but unfortunately line graph isn't really covered.
Has anyone done anything similar and care to advise? Any help appreciated.
thanks,
Graham
- Mark as New
- Bookmark
- Subscribe
- Mute
- Subscribe to RSS Feed
- Permalink
- Report Inappropriate Content
Hi Graham, I'm looking into something similar now, did u figure out a solution?
- Mark as New
- Bookmark
- Subscribe
- Mute
- Subscribe to RSS Feed
- Permalink
- Report Inappropriate Content
Hi Chelsea.
This is a very old post and may well have been superceded by better ways of doing this in JavaScript etc..
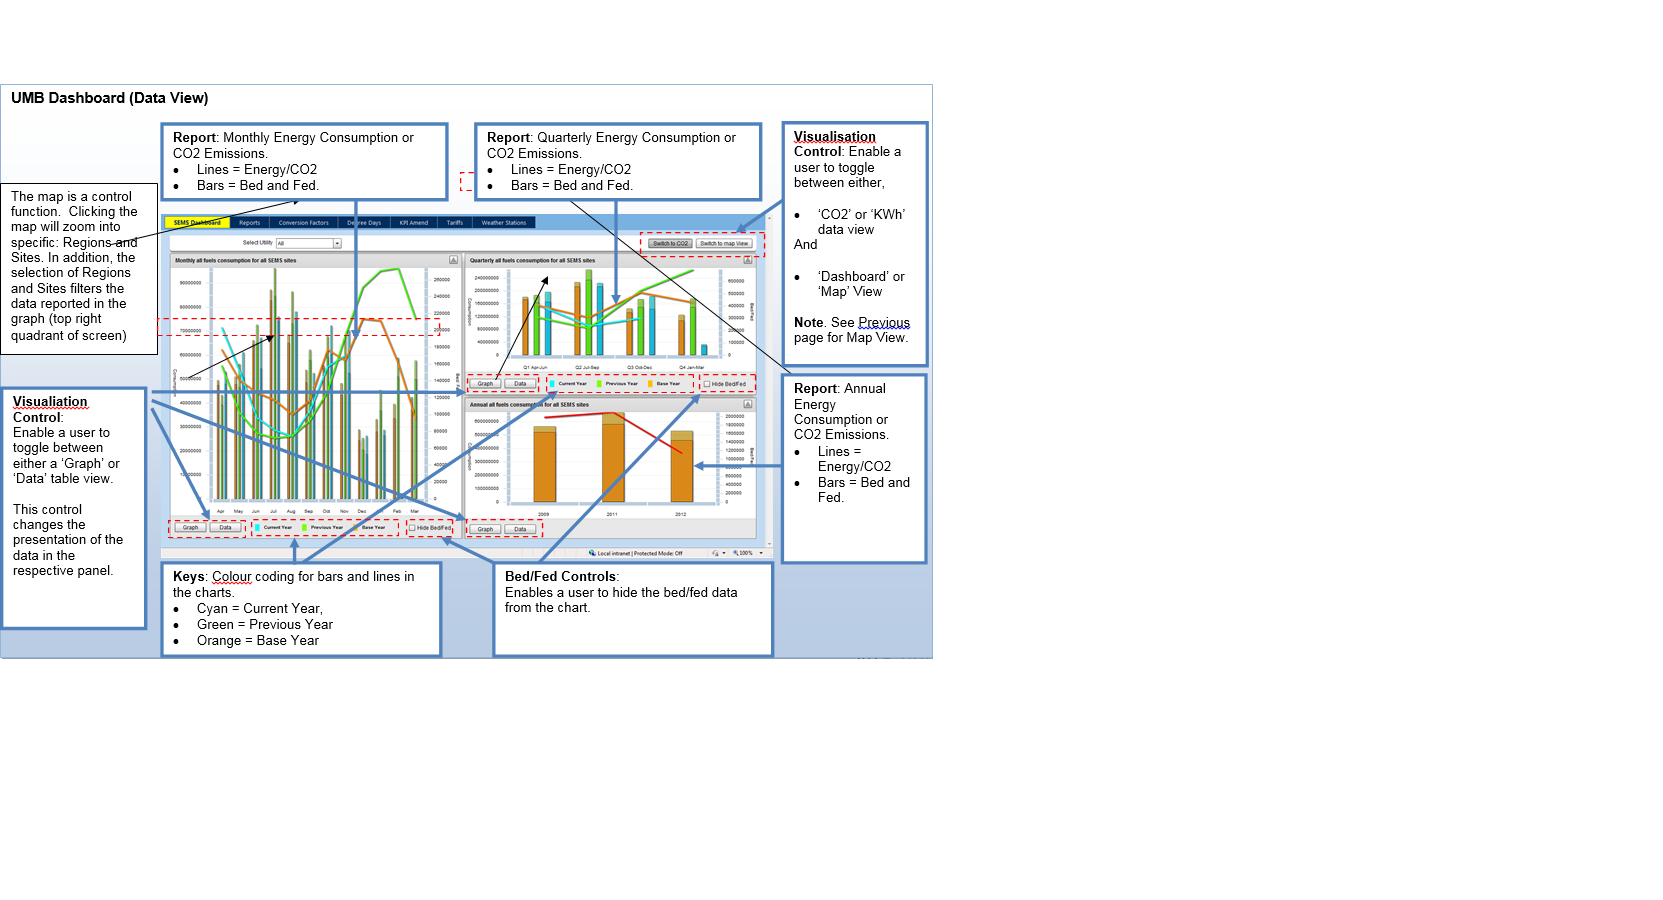
But yes, at the time I did solve this in a solution that did not use the flexviewer but instead was a from scratch flash player project. See screen shot from our user guide. If you have specific questions I can try and answer them but in essence I just created a project with an mxml file which was where I built out the dashboard
I then added a view stack into which I inserted areas for all the different charts (which can be expanded to go full screen or 'pop back' into their container area
I then used the mx.charts class in FLash to create the types of charts I wanted, configured them as required and bound them to my data sources. For multiple lines on a line chart you just add a line series for each line you want.
As I said I'm not convinced a flash based solution for any sort of future proof solution is going to be your best way forward but that is for you/your employer to decide. You might want to consider investigating javascript/angular/some other modern browser compliant technology, but seeing as I don't know what business problem you are trying to solve I cannot advise further.
Hope this helps a bit!
cheers
Graham
- Mark as New
- Bookmark
- Subscribe
- Mute
- Subscribe to RSS Feed
- Permalink
- Report Inappropriate Content
Thanks for the information and picture! I'm also trying to make an energy usage dashboard, so it's helpful to see what you've done. I'm thinking of going with one of ESRI's solutions, like Operations Dashboard, but I wish it had some of the options you built into yours like switching between map/data/chart views.
- Mark as New
- Bookmark
- Subscribe
- Mute
- Subscribe to RSS Feed
- Permalink
- Report Inappropriate Content
No problem. I dont know much about operations dashboard except it is part of ESRI's online offering. We run on premise here. I don't know how customisable / configurable / extendable dashboard is, but if your organisation is anything like mine, there will be some very specific requirements which may prove difficult to implement with an off the shelf solution.
Good luck. Please mark my post as helpful if it answered your question.
thanks,
Graham
- Mark as New
- Bookmark
- Subscribe
- Mute
- Subscribe to RSS Feed
- Permalink
- Report Inappropriate Content
nb - I can send you the code if you want, but - as I said in my original post - it is a 5 year old project written in old version of Flashplayer.
if you want the code, let me know
thanks,
Graham