Turn on suggestions
Auto-suggest helps you quickly narrow down your search results by suggesting possible matches as you type.
Cancel
- Home
- :
- All Communities
- :
- Developers
- :
- JavaScript Maps SDK
- :
- JavaScript Maps SDK Questions
- :
- infoWindow vs infoTemplate
Options
- Subscribe to RSS Feed
- Mark Topic as New
- Mark Topic as Read
- Float this Topic for Current User
- Bookmark
- Subscribe
- Mute
- Printer Friendly Page
infoWindow vs infoTemplate
Subscribe
8010
4
04-09-2012 08:04 AM
04-09-2012
08:04 AM
- Mark as New
- Bookmark
- Subscribe
- Mute
- Subscribe to RSS Feed
- Permalink
- Report Inappropriate Content
Ive got a datagrid that lists the results of a query, which are shown as points in my map.
When you click on the datagrid, I'd like an infoWindow to open on the point.
I've set infoTemplate to open an infoWindow when a point is clicked.
this seems to be all that's necessary for clicking on the point.
I've also got a datagrid.
When you click on the grid, I want the same infoWindow to open, anchored at the point.
At best, I get all the attributes, but formatted differently.
I would have thought just
would be enough, as the template has already been set.
but no, I only get an empty window.
I've created a new InfoTemplate to see if that would make a difference, and, I've tried a million combinations of the following:
The first infoTemplate creates the infowWindow with {NAME} in bold in the title, the rest in a regular font, the second selInfoTemplate creates it all in bold.
Any clue why?
When you click on the datagrid, I'd like an infoWindow to open on the point.
I've set infoTemplate to open an infoWindow when a point is clicked.
var infoTemplate = new esri.InfoTemplate("Sales Rep: ${NAME}", ("${*}"));
...
repGraphic.setInfoTemplate(infoTemplate);
map.graphics.add(repGraphic);
this seems to be all that's necessary for clicking on the point.
I've also got a datagrid.
When you click on the grid, I want the same infoWindow to open, anchored at the point.
At best, I get all the attributes, but formatted differently.
I would have thought just
map.infoWindow.show(selectedRepGraphic.geometry);
would be enough, as the template has already been set.
but no, I only get an empty window.
I've created a new InfoTemplate to see if that would make a difference, and, I've tried a million combinations of the following:
          var selInfoTemplate = new esri.InfoTemplate("Sales Rep: ${NAME}", ("${*}")); //"Rep # : ${rep_no}", "Address : ${ADDR1}");
            map.infoWindow.setTitle(selectedRepGraphic.getContent("${NAME}"));
            selectedRepGraphic.setInfoTemplate(selInfoTemplate);

            map.infoWindow.show(selectedRepGraphic.geometry);
            map.graphics.add(selectedRepGraphic);
The first infoTemplate creates the infowWindow with {NAME} in bold in the title, the rest in a regular font, the second selInfoTemplate creates it all in bold.
Any clue why?
4 Replies
04-10-2012
04:44 AM
- Mark as New
- Bookmark
- Subscribe
- Mute
- Subscribe to RSS Feed
- Permalink
- Report Inappropriate Content
Try this:
The extra () you had around the second parameter is unnecessary. The infoTemplate constructor takes two strings.
http://help.arcgis.com/en/webapi/javascript/arcgis/help/jsapi/infotemplate.htm
var selInfoTemplate = new esri.InfoTemplate("Sales Rep: ${NAME}", "${*}");
The extra () you had around the second parameter is unnecessary. The infoTemplate constructor takes two strings.
http://help.arcgis.com/en/webapi/javascript/arcgis/help/jsapi/infotemplate.htm
04-10-2012
05:04 AM
- Mark as New
- Bookmark
- Subscribe
- Mute
- Subscribe to RSS Feed
- Permalink
- Report Inappropriate Content
04-10-2012
10:43 AM
- Mark as New
- Bookmark
- Subscribe
- Mute
- Subscribe to RSS Feed
- Permalink
- Report Inappropriate Content
Not sure what specifically is different, but here is the way I am doing something similar in case it might help...
Creating the empty Popup for the map.
Define the InfoTemplate on the FeatureLayer
Then I do this after I use selectFeatures on my FeatureLayer to show popup and center the map on the selected feature...
Good luck!
Creating the empty Popup for the map.
var popup = new esri.dijit.Popup(null, dojo.create("div"));
map = new esri.Map("map", {
        extent: extent,
        width: mapWidth,
        infoWindow: popup,  //Define popup for map infowindow
        showInfoWindowOnClick: false

});
Define the InfoTemplate on the FeatureLayer
var template = new esri.InfoTemplate();
template.setContent(getTextContent);

var featureLayer = new esri.layers.FeatureLayer("http://yourserver/ArcGIS/rest/services/yourmapservice/MapServer/0", {
        mode: esri.layers.FeatureLayer.MODE_SNAPSHOT,
        outFields: ["Name","rep_no","ADDR1"],
        infoTemplate: template //Define the template for the FeatureLayer
});

function getTextContent(graphic) {

    var name= graphic.attributes.Name;
    var rep_no= graphic.attributes.rep_no;
    var address= graphic.attributes.ADDR1;

    var content = "<b>Name : </b>" + name + "<br><b>Rep # : </b>" + rep_no + "<br><b>Address : </b>" + address;

    return content;
}
Then I do this after I use selectFeatures on my FeatureLayer to show popup and center the map on the selected feature...
map.infoWindow.hide();
map.infoWindow.clearFeatures();
map.infoWindow.setFeatures(selectedRepGraphic);  //I use setFeatures to set the Map InfoWindow/Popup to the selected feature/graphic
map.infoWindow.show(selectedRepGraphic.geometry);
map.centerAndZoom(selectedRepGraphic.geometry, 7);
Good luck!
05-07-2012
10:56 AM
- Mark as New
- Bookmark
- Subscribe
- Mute
- Subscribe to RSS Feed
- Permalink
- Report Inappropriate Content
I'm still at a loss. I've tried 50 different ways of creating the popups. I have a table populated by a spatial query, and matching points in the map.
if I click on the table, I get a properly formatted popup, with bold field titles, and regular attributes
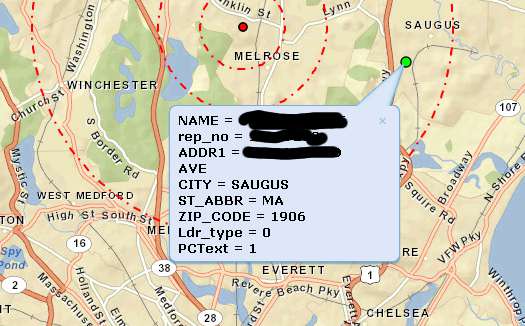
if I click in the map, I get all regular text,
If I'm lucky, I get style from my table, another from clicking in the map itself.
the extra fields shown:
_RI = true
_S = [object Object]
_0 = 0
I tried creating a separate onClick function, but I keep getting confused.
help!
Thank you all.
if I click on the table, I get a properly formatted popup, with bold field titles, and regular attributes
if I click in the map, I get all regular text,
If I'm lucky, I get style from my table, another from clicking in the map itself.
       function doRepManager(fset){ //draws the rep points, fires populateTable
//          var infoTemplate = new esri.InfoTemplate();
          var symbol = new esri.symbol.SimpleMarkerSymbol();
          symbol.style = esri.symbol.SimpleMarkerSymbol.STYLE_SQUARE;
          symbol.setSize(6);
          symbol.setColor(new dojo.Color([219, 112, 147, 1]));
          var repResultFeatures = fset.features;
          for (var i = 0, il = repResultFeatures.length; i < il; i++) {
            var repGraphic = repResultFeatures;
            repGraphic.setSymbol(symbol);
            var name = repGraphic.attributes.NAME;
            var rep_no = repGraphic.attributes.rep_no;
            var address = repGraphic.attributes.ADDR1;
            var city = repGraphic.attributes.CITY;
            var state = repGraphic.attributes.ST_ABBR;
            var zipcode = repGraphic.attributes.ZIP_CODE;
            var leader = repGraphic.attributes.Ldr_type;
            var prez = repGraphic.attributes.PCText;
            var content = "<b>Rep # : </b>" + rep_no + "<br><b>Address : </b>" + address + "<br><b>City : </b>" + city + "<br><b>State : </b>" + state + "<br><b>Zip : </b>" + zipcode + "<br><b> Leader : </b>" + leader + "<br><b>Presidents Club :</b>" + prez;
            var title = "<b>Name : </b>" + name;
            map.infoWindow.setTitle(title);
            map.infoWindow.setContent(content);
            repGraphic.setInfoTemplate(infoTemplate);
            map.graphics.add(repGraphic);
            map.infoWindow.show(repGraphic.geometry);  // <--- the popup appears properly (bold field titles) after the point is drawn (points are found by a spatial query from a buffer)
                                                                               //         but if you click on the point itself all the bold disappears, and extra fields appear at the bottom (see below)
          };
          var items = [];
          dojo.forEach(fset.features, function (feature) {
              var graphic = feature;
              graphic.setSymbol(symbol);
              map.graphics.add(graphic);
              items.push(feature.attributes);
          });
          var data = {
              identifier: "rep_no",
              items: items
          };
          store = new dojo.data.ItemFileReadStore({
              data: data
          });
          grid.setStore(store);
        };
      function onRowClickHandler(evt){
        var clickedRep = grid.getItem(evt.rowIndex).rep_no;
        var selectedRep;
        var selectedRepSymbol = new esri.symbol.SimpleMarkerSymbol();
        selectedRepSymbol.style = esri.symbol.SimpleMarkerSymbol.STYLE_CIRCLE;
        selectedRepSymbol.setSize(10);
        selectedRepSymbol.setColor(new dojo.Color([0,255,0, 1]));
        dojo.forEach(map.graphics.graphics,function(graphic){
          if((graphic.attributes) && graphic.attributes.rep_no === clickedRep){
            selectedRep = graphic;
            if (!(map.extent.contains(selectedRep.geometry))) {
              map.centerAt(selectedRep.geometry);
            };
            this.selectedRepGraphic = new esri.Graphic(selectedRep, selectedRepSymbol);
            this.selectedRepGraphic.id="highlight";
            this.selectedRepGraphic.setSymbol(selectedRepSymbol);

            var name = selectedRepGraphic.attributes.NAME;
            var rep_no = selectedRepGraphic.attributes.rep_no;
            var address = selectedRepGraphic.attributes.ADDR1;
            var city = selectedRepGraphic.attributes.CITY;
            var state = selectedRepGraphic.attributes.ST_ABBR;
            var zipcode = selectedRepGraphic.attributes.ZIP_CODE;
            var leader = selectedRepGraphic.attributes.Ldr_type;
            var prez = selectedRepGraphic.attributes.PCText;
            var content = "<b>Rep # : </b>" + rep_no + "<br><b>Address : </b>" + address + "<br><b>City : </b>" + city + "<br><b>State : </b>" + state + "<br><b>Zip : </b>" + zipcode + "<br><b> Leader : </b>" + leader + "<br><b>Presidents Club :</b>" + prez;
            var title = "<b>Name : </b>" + name;
            map.infoWindow.setTitle(title);
            map.infoWindow.setContent(content);
            selectedRepGraphic.setInfoTemplate(infoTemplate);
            map.infoWindow.show(selectedRepGraphic.geometry);

            dojo.forEach(this.map.graphics.graphics, function (g){
              if( g && g.id === "highlight" ){
                //remove graphic with specific id
              this.map.graphics.remove(g);
              }
              },this);

            map.graphics.add(this.selectedRepGraphic);

            return;
          };
        });
            return;
      };
the extra fields shown:
_RI = true
_S = [object Object]
_0 = 0
I tried creating a separate onClick function, but I keep getting confused.
help!
Thank you all.