- Home
- :
- All Communities
- :
- Products
- :
- ArcGIS Dashboards
- :
- ArcGIS Dashboards Questions
- :
- Daily Average based on Survey123 results
- Subscribe to RSS Feed
- Mark Topic as New
- Mark Topic as Read
- Float this Topic for Current User
- Bookmark
- Subscribe
- Mute
- Printer Friendly Page
Daily Average based on Survey123 results
- Mark as New
- Bookmark
- Subscribe
- Mute
- Subscribe to RSS Feed
- Permalink
- Report Inappropriate Content
I'm looking to create an indicator on my dashboard that shows the average surveys submitted daily from my live survey123 form. I can't figure out how to dynamically have it calculate how many days the survey has been open in order to find the ratio.
Help!
- Mark as New
- Bookmark
- Subscribe
- Mute
- Subscribe to RSS Feed
- Permalink
- Report Inappropriate Content
Do you want to show surveys submitted by day or just daily counts? You can either use the Serial Chart and show the count for the survey using the Creation Date as below:
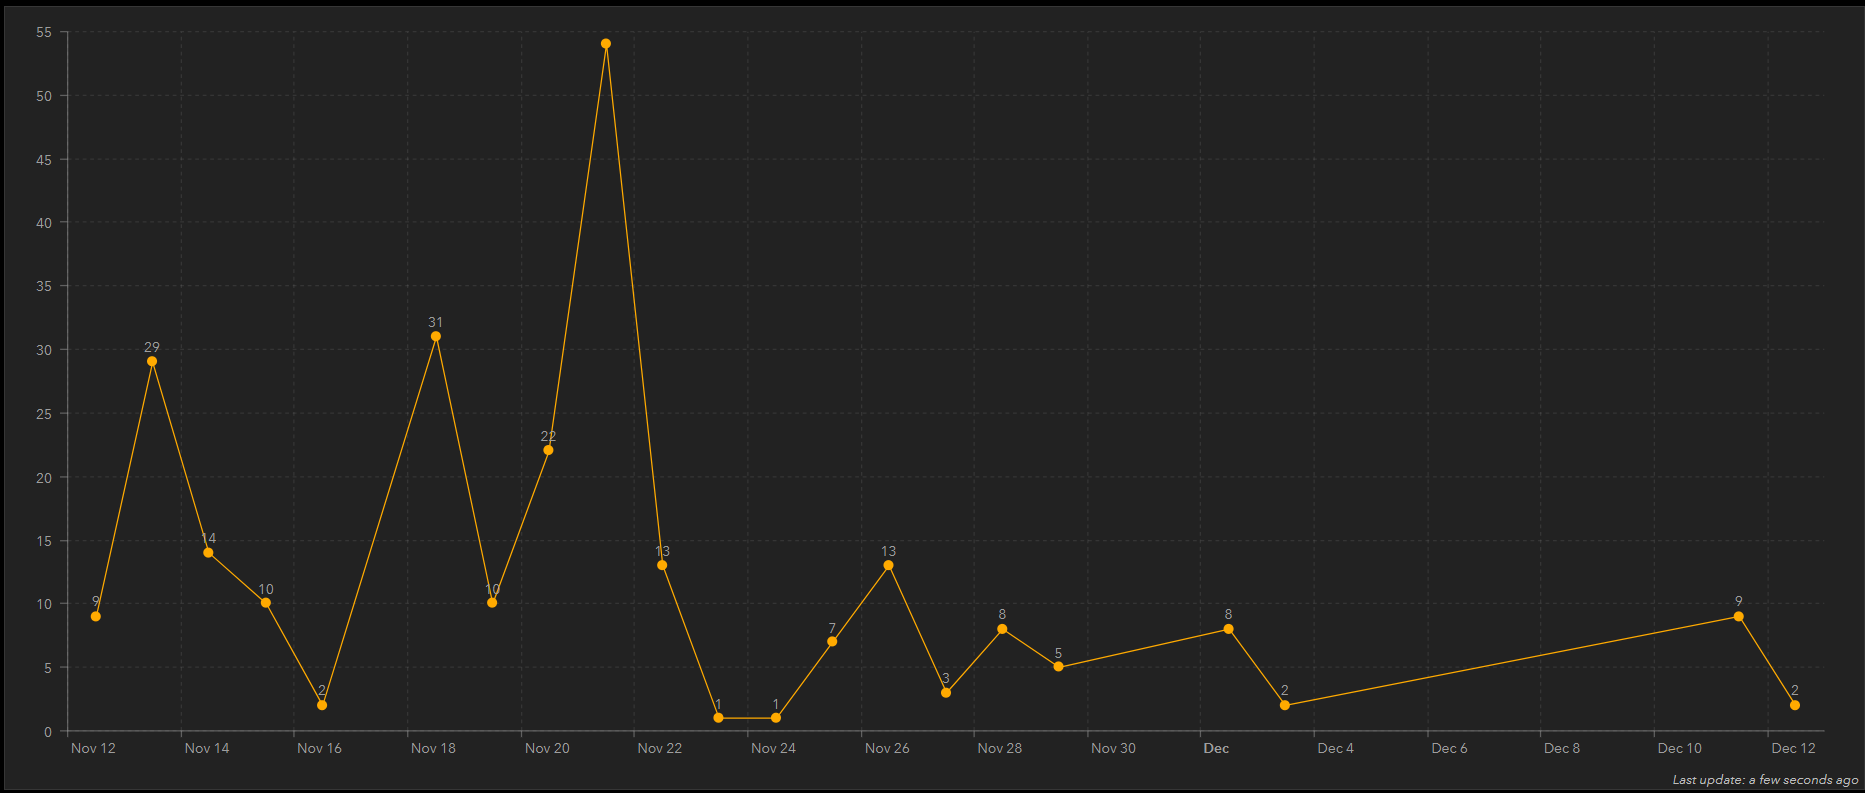
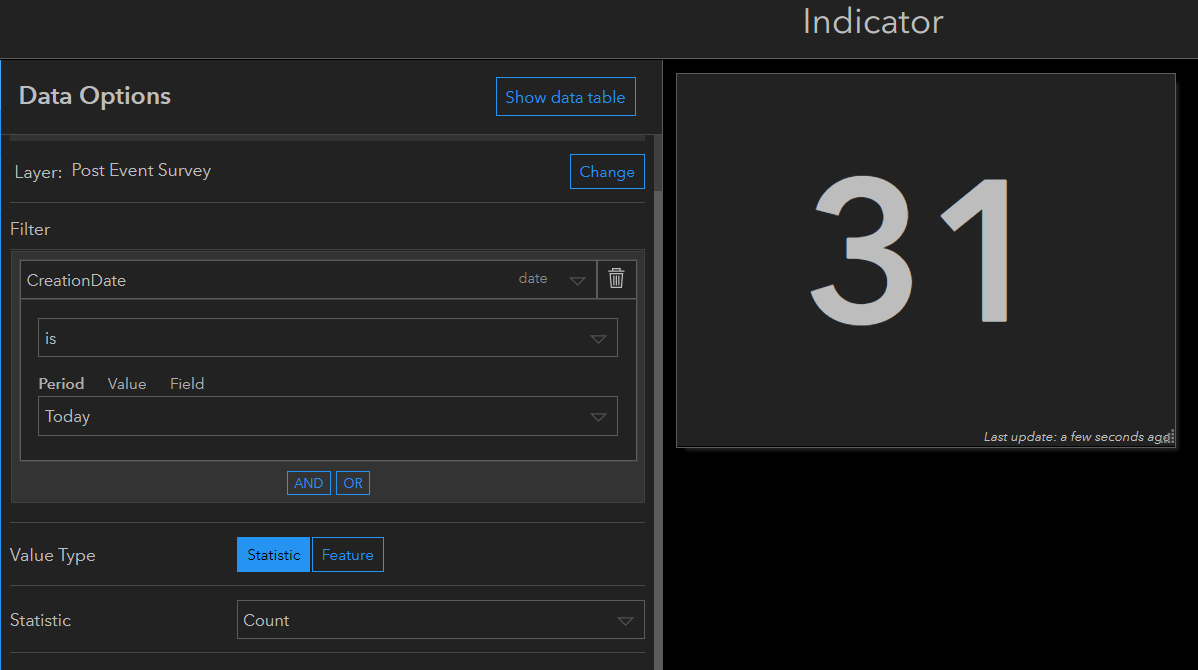
or you can use the indicator widget and set a date filter for today and display the count as below:
Cheers,
Manish
If this answer solved your question or if you found it helpful please mark it accordingly to help others who have the same question.
Manish
- Mark as New
- Bookmark
- Subscribe
- Mute
- Subscribe to RSS Feed
- Permalink
- Report Inappropriate Content
Thanks for this! I do have the serial chart showing the numbers per day, however I'm hoping to show a daily average rather than just the total surveys submitted that day (or week).
So for example, my survey has been live since June 1 and have had between 80-200 people per day submitting the survey. I would like to have an indicator that shows the daily average of submissions since the survey went live (Average surveys per day/# days survey has been live) and would like this to update as more surveys are submitted.
I can do this on a static clip of the data by just counting the # of days but I would like it to update.
Thanks for your help!
Laura
- Mark as New
- Bookmark
- Subscribe
- Mute
- Subscribe to RSS Feed
- Permalink
- Report Inappropriate Content
I was hoping to see something on this too. Ideally, I would like to have a rolling average per day as a guide line on the bar graph. However, I would even be willing to settle for an indicator with that number.