- Home
- :
- All Communities
- :
- Industries
- :
- Natural Resources
- :
- Petroleum
- :
- Petroleum Questions
- :
- I have an excel spreadsheet of pressures that is s...
- Subscribe to RSS Feed
- Mark Topic as New
- Mark Topic as Read
- Float this Topic for Current User
- Bookmark
- Subscribe
- Mute
- Printer Friendly Page
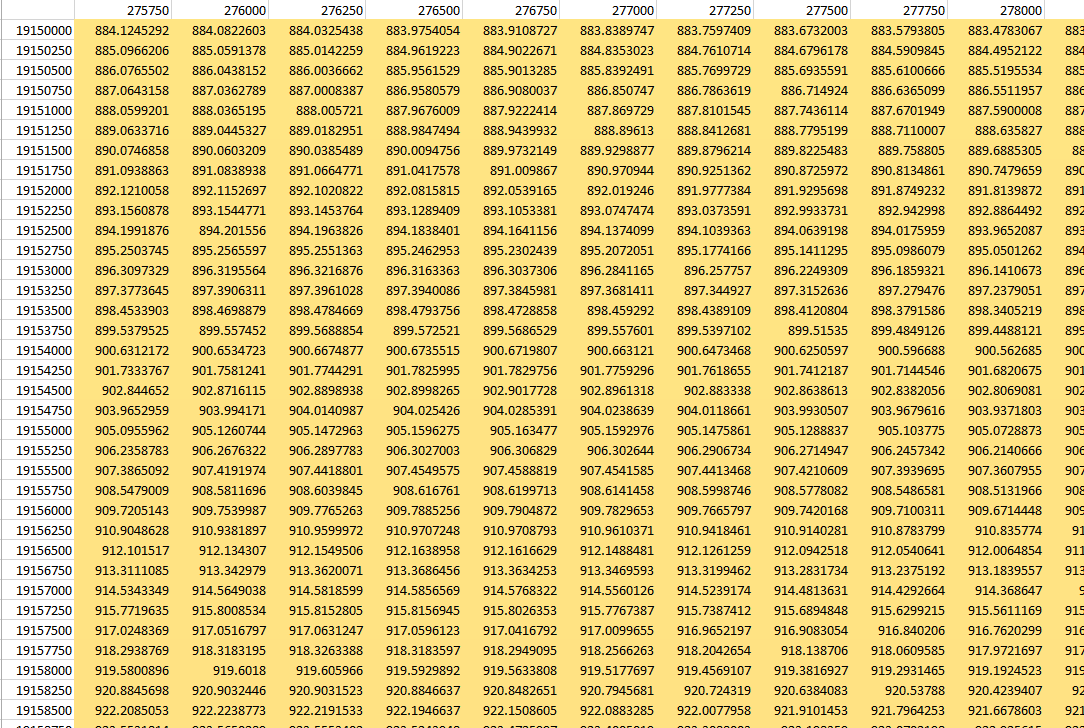
I have an excel spreadsheet of pressures that is set up like a grid with state plane coordinates on the top and left of the spreadsheet. How can I display that in ArcMap?
- Mark as New
- Bookmark
- Subscribe
- Mute
- Subscribe to RSS Feed
- Permalink
- Report Inappropriate Content
- Mark as New
- Bookmark
- Subscribe
- Mute
- Subscribe to RSS Feed
- Permalink
- Report Inappropriate Content
You can use the tool to create points from X,Y in ArcCatalog by right clicking on the table.
HOWEVER, you will need to fix the fact that someone used a needed value as a column label.
What I would suggest, Create a column to the right of each of the Columns. take the Coordinate and paste it down each column
Determine if the left column is Latitude or Longitude.
Say the column on the left is Longitude
Rename the columns with something Makes sense.
X, P1, Y1, P2, Y2 etc.. X being Longitude and P1 being the first column of pressures, Y1 being the first Latitude for the first pressure associated with that Longitude. and so on.
then you can run the XY to feature over and over until you have made a point for each Column of P's or you can copy and paste all the values into 3 columns and run it once.
Sounds messy but I could have this done in about 3.6 to 5.93 minutes.
- Mark as New
- Bookmark
- Subscribe
- Mute
- Subscribe to RSS Feed
- Permalink
- Report Inappropriate Content
Thanks Robert. Not sure why I didn’t think of that.
Paul Gienapp
Senior GIS Analyst
231.843.8878 ext: 2220