- Home
- :
- All Communities
- :
- Developers
- :
- JavaScript Maps SDK
- :
- JavaScript Maps SDK Questions
- :
- add xy coordinates to toolbar
- Subscribe to RSS Feed
- Mark Topic as New
- Mark Topic as Read
- Float this Topic for Current User
- Bookmark
- Subscribe
- Mute
- Printer Friendly Page
- Mark as New
- Bookmark
- Subscribe
- Mute
- Subscribe to RSS Feed
- Permalink
- Report Inappropriate Content
Hi all
With the ability to use graphic draw tools (point, line, polygons) and create the objects to use in a query such as those in this example:
https://developers.arcgis.com/javascript/3/samples/util_buffergraphic/
How would I customise this so as to be able to enter x,y coordinates manually to create an object such as a point, line or polygon and then buffer this?
I have a simple create a point object and zoom to it taking in user entered x,y coordinates using the following:
on(dom.byId("btnFindCoordinates"), "click", function() {
map.graphics.clear();
var x = dom.byId("xCoord").value;
var y = dom.byId("yCoord").value;
var coordPoint = new Point(x,y);
prjParams.geometries = [coordPoint];
map.centerAndZoom(coordPoint, 11);
map.graphics.add(new Graphic(coordPoint, markerSymbol));
});
But not sure how I would add this into the example above, any hints welcome.
Thanks and best,
Mark
Solved! Go to Solution.
Accepted Solutions
- Mark as New
- Bookmark
- Subscribe
- Mute
- Subscribe to RSS Feed
- Permalink
- Report Inappropriate Content
Mark,
This should get you going:
<!DOCTYPE html>
<html>
<head>
<meta http-equiv="Content-Type" content="text/html; charset=utf-8">
<meta name="viewport" content="initial-scale=1, maximum-scale=1,user-scalable=no">
<title>Buffer</title>
<link rel="stylesheet" href="https://js.arcgis.com/3.29/dijit/themes/claro/claro.css">
<link rel="stylesheet" href="https://js.arcgis.com/3.29/esri/css/esri.css">
<style>
html, body {
height: 100%;
width: 100%;
margin: 0;
padding: 0;
overflow:hidden;
}
#leftPane{
color:#000;
width:250px;
padding-bottom:15px;
}
#map{
padding:0;
}
.details{
font-size:14px;
font-weight:600;
padding-bottom:20px;
}
button{
margin:2px;
cursor:pointer;
}
</style>
<script src="https://js.arcgis.com/3.29/"></script>
<script>
var map, tb;
require(["dojo/dom",
"dojo/_base/array",
"dojo/parser",
"dojo/query",
"dojo/on",
"esri/Color",
"esri/config",
"esri/map",
"esri/graphic",
"esri/geometry/Point",
"esri/geometry/normalizeUtils",
"esri/tasks/GeometryService",
"esri/tasks/BufferParameters",
"esri/toolbars/draw",
"esri/symbols/SimpleMarkerSymbol",
"esri/symbols/SimpleLineSymbol",
"esri/symbols/SimpleFillSymbol",
"dijit/layout/BorderContainer",
"dijit/layout/ContentPane",
"dijit/form/Button", "dojo/domReady!"
],
function(dom, array, parser, query, on, Color, esriConfig, Map, Graphic, Point, normalizeUtils, GeometryService, BufferParameters, Draw, SimpleMarkerSymbol, SimpleLineSymbol, SimpleFillSymbol){
parser.parse();
esriConfig.defaults.geometryService = new GeometryService("https://utility.arcgisonline.com/ArcGIS/rest/services/Geometry/GeometryServer");
esriConfig.defaults.io.proxyUrl = "/proxy/";
esriConfig.defaults.io.alwaysUseProxy = false;
//Setup button click handlers
on(dom.byId("clearGraphics"), "click", function(){
if(map){
map.graphics.clear();
}
});
//click handler for the draw tool buttons
query(".tool").on("click", function(evt){
if(tb){
tb.activate(evt.target.id);
}
});
on(dom.byId("btnFindCoordinates"), "click", function() {
//map.graphics.clear();
var x = dom.byId("xCoord").value;
var y = dom.byId("yCoord").value;
var coordPoint = new Point(x,y, map.spatialReference);
// prjParams.geometries = [coordPoint];
// map.centerAndZoom(coordPoint, 11);
// map.graphics.add(new Graphic(coordPoint, markerSymbol));
doBuffer({geometry: coordPoint});
});
map = new Map("map", {
basemap: "streets",
center: [-111.5, 39.541],
zoom: 7
});
map.on("load", initToolbar);
function initToolbar(evtObj) {
tb = new Draw(evtObj.map);
tb.on("draw-end", doBuffer);
}
function doBuffer(evtObj) {
tb.deactivate();
var geometry = evtObj.geometry, symbol;
console.info(evtObj.geometry);
switch (geometry.type) {
case "point":
symbol = new SimpleMarkerSymbol(SimpleMarkerSymbol.STYLE_SQUARE, 10, new SimpleLineSymbol(SimpleLineSymbol.STYLE_SOLID, new Color([255,0,0]), 1), new Color([0,255,0,0.25]));
break;
case "polyline":
symbol = new SimpleLineSymbol(SimpleLineSymbol.STYLE_DASH, new Color([255,0,0]), 1);
break;
case "polygon":
symbol = new SimpleFillSymbol(SimpleFillSymbol.STYLE_NONE, new SimpleLineSymbol(SimpleLineSymbol.STYLE_DASHDOT, new Color([255,0,0]), 2), new Color([255,255,0,0.25]));
break;
}
var graphic = new Graphic(geometry, symbol);
map.graphics.add(graphic);
//setup the buffer parameters
var params = new BufferParameters();
params.distances = [ dom.byId("distance").value ];
params.outSpatialReference = map.spatialReference;
params.unit = GeometryService[dom.byId("unit").value];
//normalize the geometry
normalizeUtils.normalizeCentralMeridian([geometry]).then(function(normalizedGeometries){
var normalizedGeometry = normalizedGeometries[0];
if (normalizedGeometry.type === "polygon") {
//if geometry is a polygon then simplify polygon. This will make the user drawn polygon topologically correct.
esriConfig.defaults.geometryService.simplify([normalizedGeometry], function(geometries) {
params.geometries = geometries;
esriConfig.defaults.geometryService.buffer(params, showBuffer);
});
} else {
params.geometries = [normalizedGeometry];
esriConfig.defaults.geometryService.buffer(params, showBuffer);
}
});
}
function showBuffer(bufferedGeometries) {
var symbol = new SimpleFillSymbol(
SimpleFillSymbol.STYLE_SOLID,
new SimpleLineSymbol(
SimpleLineSymbol.STYLE_SOLID,
new Color([255,0,0,0.65]), 2
),
new Color([255,0,0,0.35])
);
array.forEach(bufferedGeometries, function(geometry) {
var graphic = new Graphic(geometry, symbol);
map.graphics.add(graphic);
});
}
});
</script>
</head>
<body class="claro">
<div data-dojo-type="dijit/layout/BorderContainer"
data-dojo-props="gutters:'true', design:'sidebar'"
style="width:100%;height:100%;">
<div id="map"
data-dojo-type="dijit/layout/ContentPane"
data-dojo-props="region:'center'">
</div>
<div id="leftPane"
data-dojo-type="dijit/layout/ContentPane"
data-dojo-props="region:'left'">
<div class="details">Pick a tool and draw on the map. The drawn graphic will be buffered based on the specified parameters.</div>
<button type="button" class="tool" id="point">Point</button>
<button type="button" class="tool" id="line">Line</button>
<button type="button" class="tool" id="polyline">Polyline</button>
<button type="button" class="tool" id="freehandpolyline">Freehand Polyline</button>
<br/>
<button type="button" class="tool" id="polygon">Polygon</button>
<button type="button" class="tool" id="freehandpolygon">Freehand Polygon</button>
<br/><hr />
<input type="text" id="xCoord" value="-12618808.947932854"/>
<input type="text" id="yCoord" value="4817809.013508325"/><br/>
<button type="button" id="btnFindCoordinates">Place Point</button>
<br/><hr />
<div><b>Buffer Parameters</b></div>
Distance: <input type="text" id="distance" size="5" value="25" />
<select id="unit" style="width:100px;">
<option value="UNIT_STATUTE_MILE">Miles</option>
<option value="UNIT_FOOT">Feet</option>
<option value="UNIT_KILOMETER">Kilometers</option>
<option value="UNIT_METER">Meters</option>
<option value="UNIT_NAUTICAL_MILE">Nautical Miles</option>
<option value="UNIT_US_NAUTICAL_MILE">US Nautical Miles</option>
<option value="UNIT_DEGREE">Degrees</option>
</select><br />
<button type="button" id="clearGraphics">Clear Graphics</button>
</div>
</div>
</body>
</html>
- Mark as New
- Bookmark
- Subscribe
- Mute
- Subscribe to RSS Feed
- Permalink
- Report Inappropriate Content
Why thank you Robert, this is exactly what I have been looking for and will assist me getting this functionality into my tool.
Very best,
Mark
- Mark as New
- Bookmark
- Subscribe
- Mute
- Subscribe to RSS Feed
- Permalink
- Report Inappropriate Content
Dear Mark,
I highly appreciate if you can help me to write the same tool (just the first part, add x y tool button with out the buffer part).
on(dom.byId("btnFindCoordinates"), "click", function() {
map.graphics.clear();
var x = dom.byId("xCoord").value;
var y = dom.byId("yCoord").value;
var coordPoint = new Point(x,y);
prjParams.geometries = [coordPoint];
map.centerAndZoom(coordPoint, 11);
map.graphics.add(new Graphic(coordPoint, markerSymbol));
});
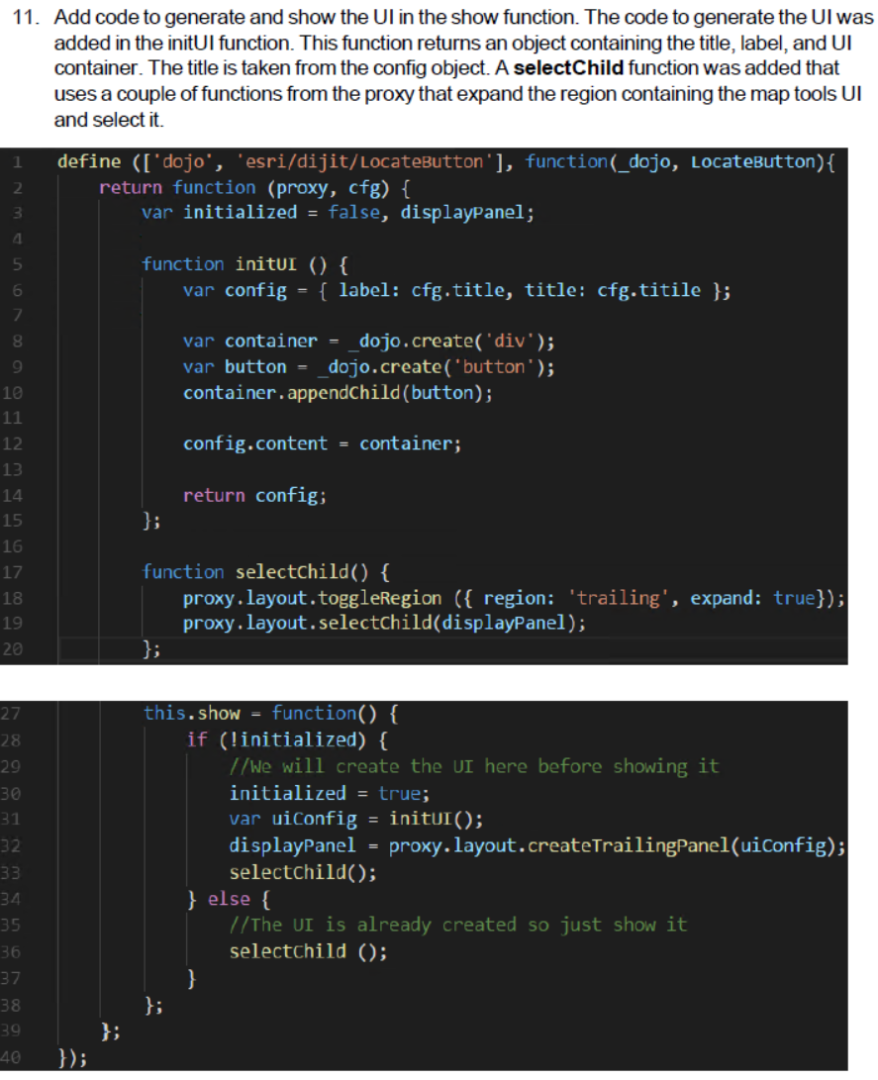
In our work we are using the cityworks application and in order to add a new tool, we need to write the .js file, an example of "homebutton" is as shown. it should be in the same written in the same way in order to add to the cityworks may.
define(['dojo', 'esri/dijit/Button'], function(_dojo, HomeButton){
return function (proxy, cfg){
var initialized = false;
var displayPanel;
function initUI() {
var config = {label: cfg.title, title: cfg.title};
var container = _dojo.create('div');
var button = _dojo.create('button');
container.appendChild(button);
var homeButton = new HomeButton({map: proxy.map.get()}, button);
homeButton.startup();
config.content = container;
return config;
}
function selectChild(){
//proxy.layout.toggleRegion({region: 'trailing', expand: true});
proxy.layout.selectChild(displayPanel);
}
this.init = function() {
var dfd = proxy.utility.deferred();
dfd.resolve();
return dfd;
};
this.show = function(){
if (!initialized){
initialized = true;
var uiConfig = initUI();
displayPanel = proxy.layout.createTrailingPanel(uiConfig);
selectChild();
}
else{
selectChild()
}
}
}
})P.S: I am new to API for JS.
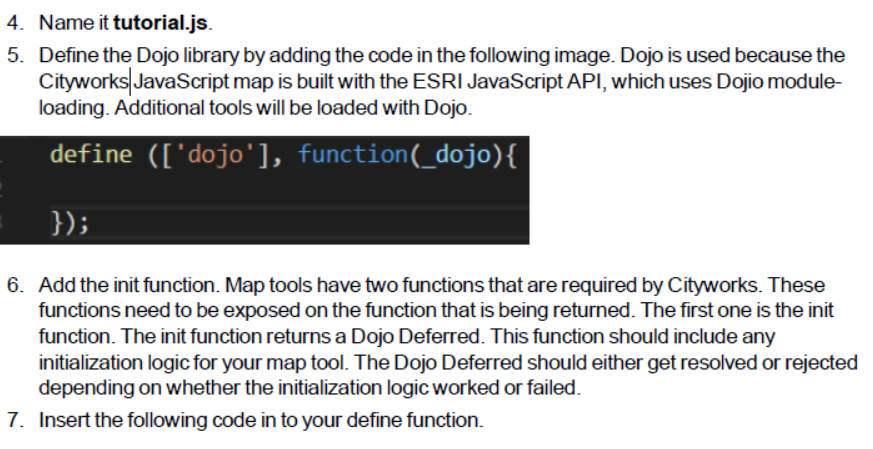
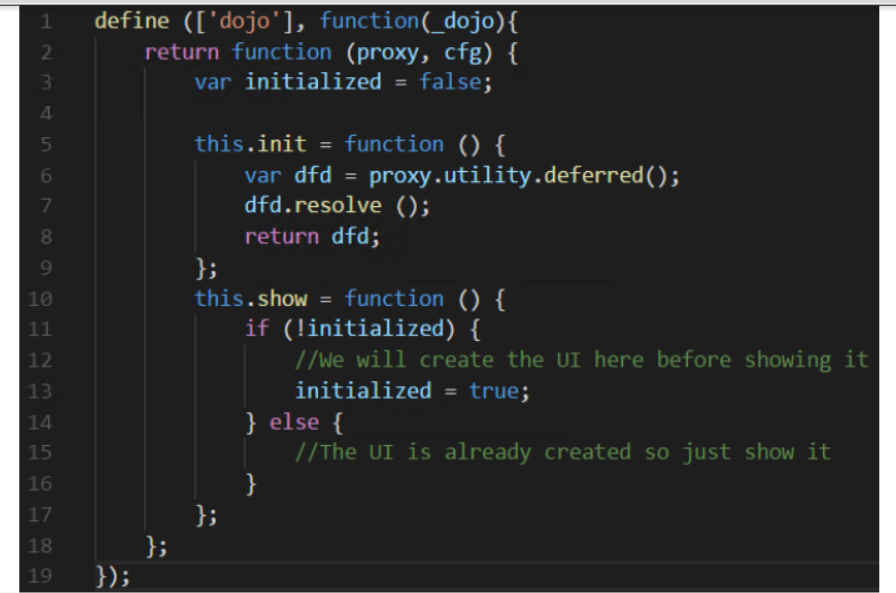
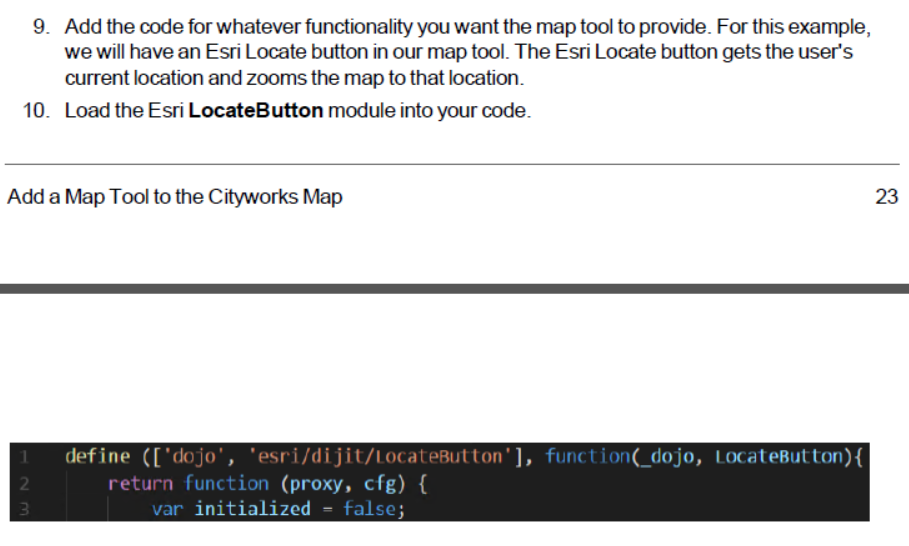
the guild line for the company to add a new tool is as shown:

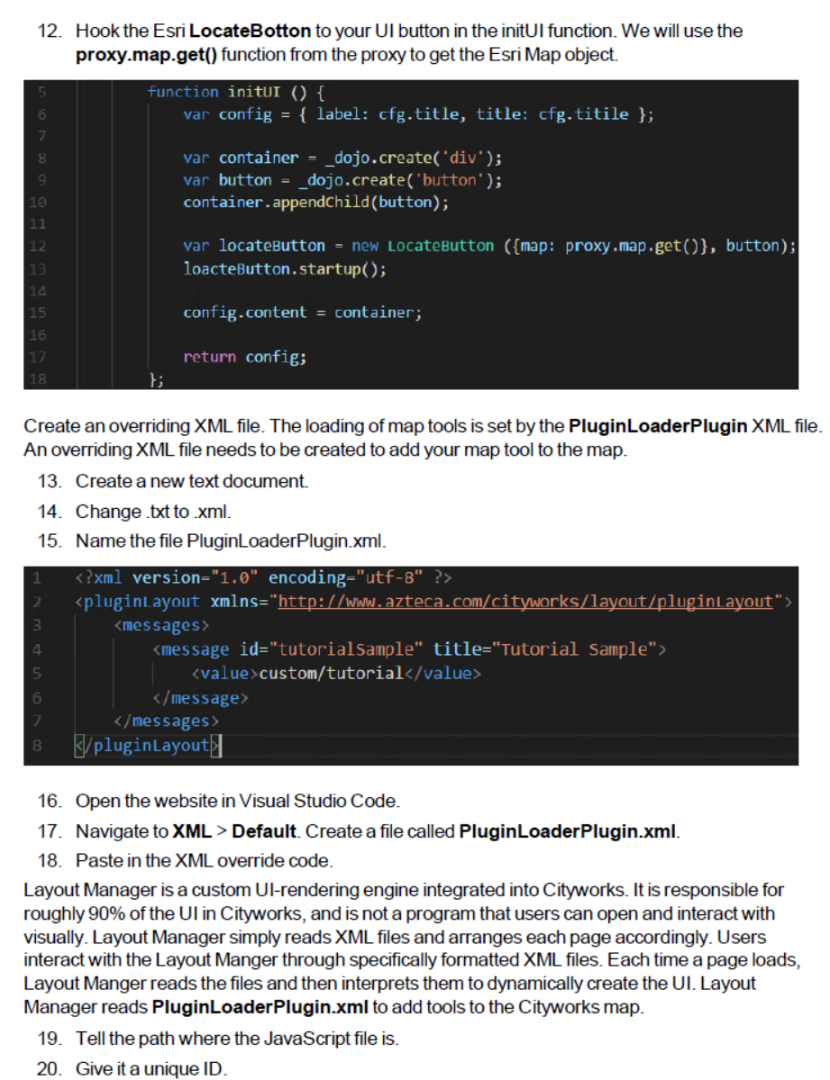
Thank you in advance.
Best
Majdoleen
- Mark as New
- Bookmark
- Subscribe
- Mute
- Subscribe to RSS Feed
- Permalink
- Report Inappropriate Content
Hi Majdoleen
Apologies that I haven't responded until now, am not sure I am the best person to ask this to, perhaps better if you posted this into the ESRI javascript community as there are many folk better placed to help (I am also newish to javascript).
Sorry I cannot assist further, good luck with your project!
Mark
- Mark as New
- Bookmark
- Subscribe
- Mute
- Subscribe to RSS Feed
- Permalink
- Report Inappropriate Content
Thank you Mark for your reply, I found this code but I need to edit it according to the above steps, I will post into the ESRI javascript community:
///////////////////////////////////////////////////////////////////////////
// Copyright © 2015 Esri Japan. All Rights Reserved.
//
// Licensed under the Apache License Version 2.0 (the "License");
// you may not use this file except in compliance with the License.
// You may obtain a copy of the License at
//
// http://www.apache.org/licenses/LICENSE-2.0
//
// Unless required by applicable law or agreed to in writing, software
// distributed under the License is distributed on an "AS IS" BASIS,
// WITHOUT WARRANTIES OR CONDITIONS OF ANY KIND, either express or implied.
// See the License for the specific language governing permissions and
// limitations under the License.
///////////////////////////////////////////////////////////////////////////
define([
'dojo/_base/declare',
'jimu/BaseWidget',
'jimu/utils',
'dijit/form/Button',
'esri/symbols/SimpleMarkerSymbol',
'esri/geometry/Point',
'esri/graphic',
'esri/layers/GraphicsLayer',
'esri/Color',
'dojo/on',
'dojo/_base/lang'
],
function(
declare,
BaseWidget,
utils,
Button,
SimpleMarkerSymbol,
Point,
Graphic,
GraphicsLayer,
Color,
on,
lang
) {
return declare([BaseWidget], {
name: 'קפוץ לנ.צ', //" jump to X Y"
baseClass: 'jimu-widget-GoToXY',
postCreate: function() {
console.log("postCreate!");
var mapFrame = this;
this.inherited(arguments);
this.addPointsButton = new Button({
label: "קפוץ לנקודה" //"jump to point"
}).placeAt(this.createPointIdNode);
this.clearPointsButton = new Button({
label: "נקה נקודות" //"clear markers"
}).placeAt(this.removePointIdNode);
this.addPointsButton.startup();
},
startup: function() {
console.log("startup!");
this.layer = new GraphicsLayer({
dataAttributes:["id"]
});
if (this.layer.surfaceType === "svg") {
on(this.layer, "graphic-draw", function (evt) {
console.log("graphic-draw");
var renderercategory;
renderercategory = "GoToXY";
evt.node.setAttribute("data-uniquevalue", renderercategory);
});
}
this.map.addLayer(this.layer);
on(this.addPointsButton, "click", lang.hitch(this, "createPoint"));
on(this.clearPointsButton, "click", lang.hitch(this, "clearPoint"));
console.log("this.map: ", this.map);
},
createPoint: function() {
var xx=Number(document.getElementById("ProjXBox").value);
var yy=Number(document.getElementById("ProjYBox").value);
if ((xx<165000)|| (xx>230000)){ //limit the area of x can be
document.getElementById("ProjXBox").style.backgroundColor = "red";
document.getElementById("ProjXBox").value = "נקודה מחוץ לתחום"; //"point x out of erea"
}else{
if ((yy<539000)|| (yy>594000)){
document.getElementById("ProjYBox").style.backgroundColor = "red";
document.getElementById("ProjYBox").value = "נקודה מחוץ לתחום"; //"point y out of erea"
}else{
document.getElementById("ProjYBox").style.backgroundColor = "white";
document.getElementById("ProjXBox").style.backgroundColor = "white";
console.log("createPoint!");
var ZoomIt = Number(10);
var sympath = "M16 0c-5.523 0-10 4.477-10 10 0 10 10 22 10 22s10-12 10-22c0-5.523-4.477-10-10-10zM16 16.125c-3.383 0-6.125-2.742-6.125-6.125s2.742-6.125 6.125-6.125 6.125 2.742 6.125 6.125-2.742 6.125-6.125 6.125zM12.125 10c0-2.14 1.735-3.875 3.875-3.875s3.875 1.735 3.875 3.875c0 2.14-1.735 3.875-3.875 3.875s-3.875-1.735-3.875-3.875z";
var symcolor = "#ce641d";
var sym = new SimpleMarkerSymbol();
sym.setPath(sympath);
sym.setColor(new Color(symcolor));
sym.setOutline(null);
sym.setSize("30");
var randx = document.getElementById("ProjXBox").value;
var randy = document.getElementById("ProjYBox").value;
var attr = {"id":"rand"};
var zoomPoint = new esri.geometry.Point(Number(randx),Number(randy), this.map.spatialReference);
this.map.centerAndZoom(zoomPoint,10);
var pt = new Point(randx, randy, this.map.spatialReference);
pntd=new Graphic(pt, sym, attr);
this.layer.add(pntd);
}
}
},
clearPoint: function() {
this.layer.clear();
//this.map.removeLayer(this.layer)
}
});
});