- Home
- :
- All Communities
- :
- Industries
- :
- Transportation
- :
- Transportation Questions
- :
- Hotspot Analysis Symbology is Gone?
- Subscribe to RSS Feed
- Mark Topic as New
- Mark Topic as Read
- Float this Topic for Current User
- Bookmark
- Subscribe
- Mute
- Printer Friendly Page
- Mark as New
- Bookmark
- Subscribe
- Mute
- Subscribe to RSS Feed
- Permalink
- Report Inappropriate Content
Hello community,
I have run a hotspot analysis on a set of data and wanted to take that output into a custom template to quickly generate several maps, however, when I brought my hotspot point feature class into the template all of the symbology was gone -- such as the 99%-red all the way down to the 99%-blue. I'd like to bring this symbology back into play here but I have not found any helpful methods of doing this here on the forums or anywhere else for that matter.
Here is a picture of what I have currently:
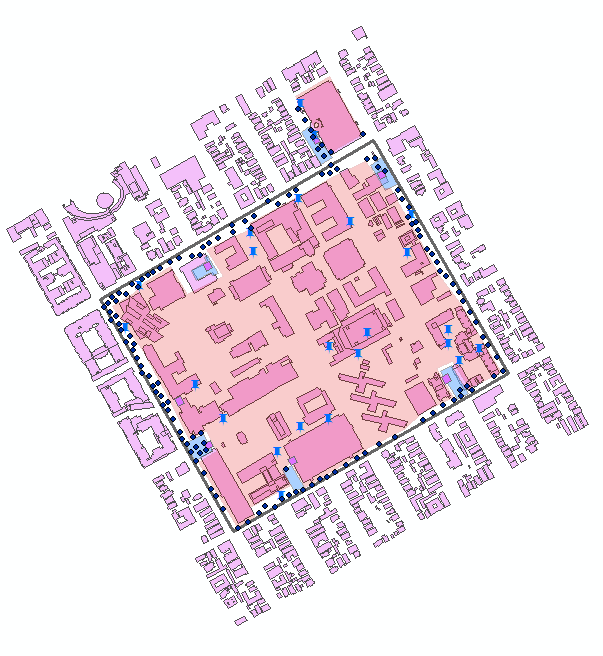
Please, if you can point me in the right direction, that'd be awesome!
Solved! Go to Solution.
Accepted Solutions
- Mark as New
- Bookmark
- Subscribe
- Mute
- Subscribe to RSS Feed
- Permalink
- Report Inappropriate Content
Hmmm...I wonder if by creating a template for the project/map, it "forgets" the symbology. One thing to try is with the Map View that does have proper hot spot symbology, share it as a Layer File. Then in your new projects, add the Layer File but repoint the source data. Would that work?
- Mark as New
- Bookmark
- Subscribe
- Mute
- Subscribe to RSS Feed
- Permalink
- Report Inappropriate Content
I'll try that after dinner, though, I'd like to also mention that when running the hotspot analysis it saves the file into a feature set -- point in this case -- and that was what I brought into the template. Perhaps the point feature loses its symbology?
- Mark as New
- Bookmark
- Subscribe
- Mute
- Subscribe to RSS Feed
- Permalink
- Report Inappropriate Content
That worked! Thanks so much!