- Home
- :
- All Communities
- :
- Products
- :
- ArcGIS Spatial Analyst
- :
- ArcGIS Spatial Analyst Questions
- :
- Different results between Zonal Statistics and Zon...
- Subscribe to RSS Feed
- Mark Topic as New
- Mark Topic as Read
- Float this Topic for Current User
- Bookmark
- Subscribe
- Mute
- Printer Friendly Page
Different results between Zonal Statistics and Zonal Statistics as Table?
- Mark as New
- Bookmark
- Subscribe
- Mute
- Subscribe to RSS Feed
- Permalink
- Report Inappropriate Content
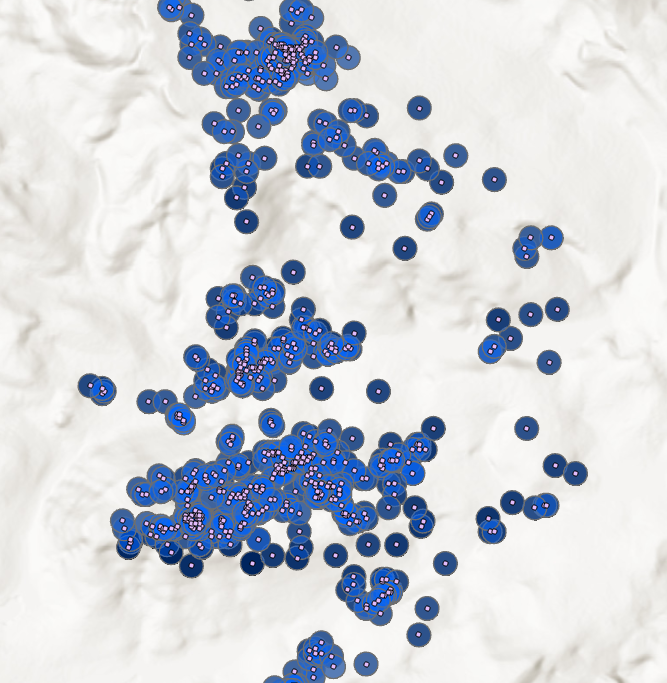
I have a collection of about 1300 points and for each point I want to get the average of a raster layer within a 50 m buffer. I have overlapping polygons. I've been scouring the forums for days now and I still haven't been able to come up with a solution that works. Here's an idea of what my data looks like
My current workflow is to to run Zonal Statistics as Table, digest it into a dictionary, and then use that to populate a field in my buffer layer. The following is my code (modified from something I found on a forum):
out = output workspace
features = arcpy.Buffer_analysis(pointfc, out + '\\name', '50 Meters')
zone_field = "OBJECTID"
input_raster = raster file
field_name = "Average"
field_type = "DOUBLE"
stat = "MEAN"
import arcpy
from arcpy.sa import *
# Add zone field to features
arcpy.AddField_management(features, field_name, field_type)
# Clear path for temporary table
if arcpy.Exists("zonal_table"):
try:
arcpy.Delete_management("zonal_table")
except:
arcpy.AddError("Unable to clear temp table")
sys.exit(-1)
# Zonal statistics
print("Performing zonal statistics: " + field_name)
zonal_table = ZonalStatisticsAsTable(features,zone_field, input_raster, out + "\\zonal_table", "DATA", stat)
# Digest statistics from zonal_table
print("Digesting " + stat + " from zonal table")
stat_dict = {}
with arcpy.da.SearchCursor(zonal_table,[zone_field,stat]) as cursor:
for row in cursor:
stat_dict[row[0]] = row[1]
print("dictionary done")
# update new field in feature class
print("updating field")
arcpy.AddMessage("Calculating " + field_name)
with arcpy.da.UpdateCursor(features, [zone_field, field_name]) as cursor2:
for row2 in cursor2:
row2[1] = stat_dict[row2[0]]
cursor2.updateRow(row2)The process works; however, my results are mostly different than what I get from running Zonal Statistics and comparing the point to the underlying raster. All of my data is in the same projected coordinate system. I've seen that there are issues with the way the snap rasters are implemented and have tried converting my buffer to raster (outside of the code on a small subset to test) without any better results. I also saw that the underlying bug was resolved in 10.5, but I still have differing results between Zonal Statistics and Zonal Statistics as Table in both 10.6 and ArcPro 2.3.
Is the issue with the Zonal Statistics or the Zonal Statistics as Table tool? Or is there another hole in my workflow somewhere I'm not considering? I'm about out of stuff to check, so any ideas are greatly appreciated.
- Mark as New
- Bookmark
- Subscribe
- Mute
- Subscribe to RSS Feed
- Permalink
- Report Inappropriate Content
From here
Zonal Statistics—Help | ArcGIS Desktop
If the Input raster or feature zone data (in_zone_data in Python) has overlapping polygons, the zonal analysis will not be performed for each individual polygon. Since the feature input is converted to a raster, each location can only have one value.
An alternative method is to process the zonal operation iteratively for each of the polygon zones and collate the results.
Overlaps could be the issue and iteration the solution since a full out zone raster can only hold one value leaving your zones not full circles
- Mark as New
- Bookmark
- Subscribe
- Mute
- Subscribe to RSS Feed
- Permalink
- Report Inappropriate Content
Thanks Dan. However, when I compare results on a polygon without an overlap, the results are still inconsistent. Would the results from Zonal Statistics still be compromised by overlapping polygons even for the points that do not have overlapping polygons? Would the iterated results using As Table be more reliable?
Also, another point I forgot to mention, Zonal Stats as Table is only running on about 900 out of the 1300 points. I've even tried subsetting my processing (i.e selecting the points that didn't process and running it again, skipping the point it failed on, etc.) and I couldn't get it to process the last few hundred points. I couldn't find any obvious reason in the data why that would fail. Any ideas on what I can check there?
- Mark as New
- Bookmark
- Subscribe
- Mute
- Subscribe to RSS Feed
- Permalink
- Report Inappropriate Content
You would need to report point spacing relative to raster cell size... sounds like some of the points are getting bumped.
Can you isolate a small area where you know that things aren't working out, for further investigation?
- Mark as New
- Bookmark
- Subscribe
- Mute
- Subscribe to RSS Feed
- Permalink
- Report Inappropriate Content
Here is an image of the ~400 that aren't processing (and then zoomed in so you can see some of the spacing)

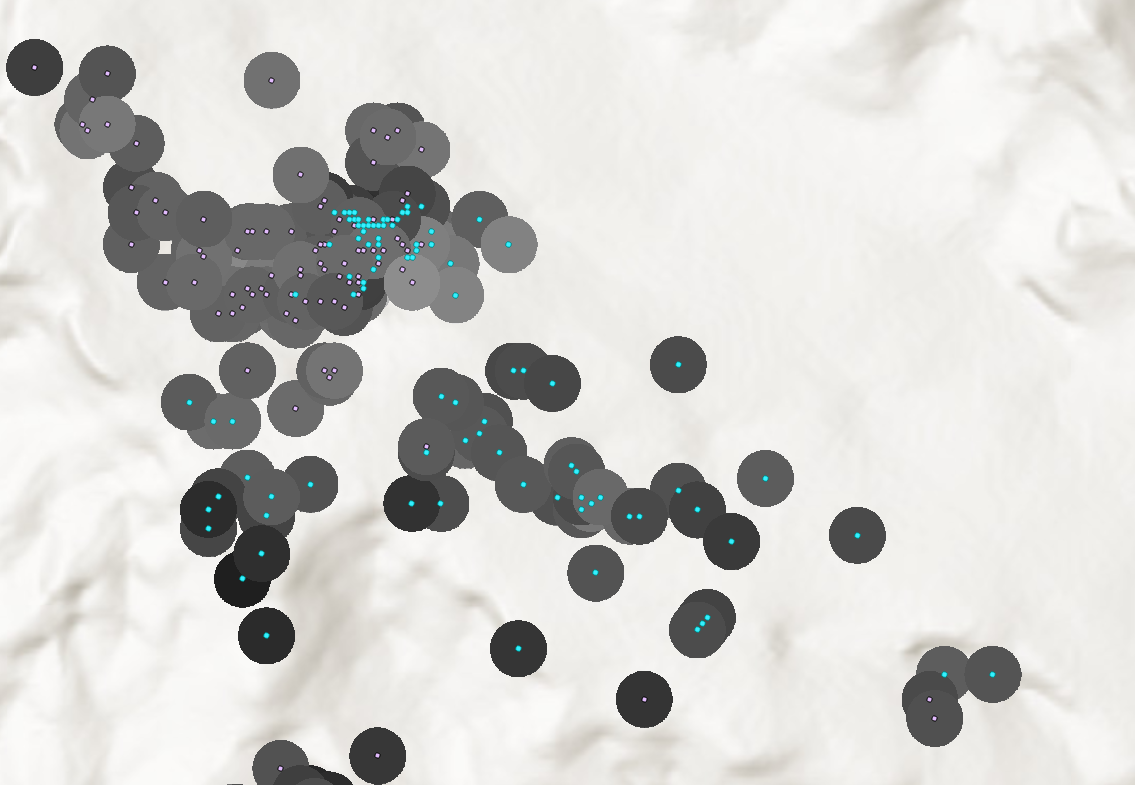
The raster cell size is about 0.6 meters.
I took the selected points above (the ones that didn't process) and exported them as a separate file for good measure. I will also mention that in my code above, I get a key error, I assume because the zonal stats doesn't run so it doesn't return a value in the dictionary.
Rerunning the code on the subset of the data works on the first ~200 points, and then throws a key error again. In the image below, the yellow circle in the last point that processed correctly, and the blue circle is the first one that didn't.
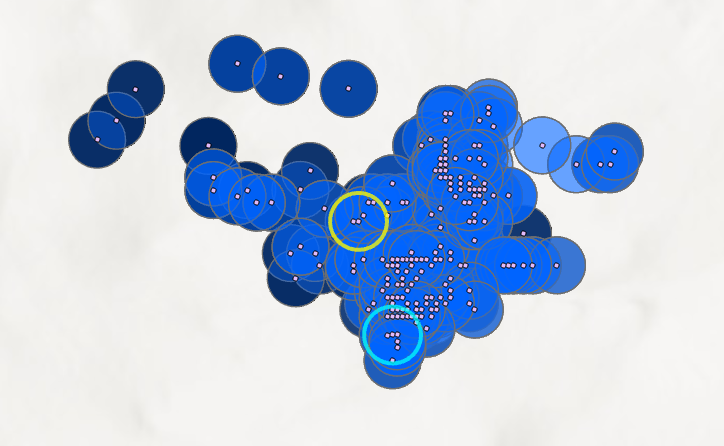
I repeated this process another time after this (subsetting the data into a separate file and rerunning the code) and it again gave me a key error about halfway into the dataset. The last point that worked and the first one that didn't are similar to the pattern you see above.
I'm down to my last 100 or so points so I could just repeat the process until it gets all of the points done and then combine everything into the original point file, but I will need to repeat this process with several other datasets so it's not the most practical solution.
- Mark as New
- Bookmark
- Subscribe
- Mute
- Subscribe to RSS Feed
- Permalink
- Report Inappropriate Content
looking at your point separation … many really really close then huge gaps and clusters.
I would start by using a smaller spacing, dissolve the buffers and runs some stats on those areas.
Unless those points were sampled with some strategy in mind, I m not sure why you would have many areas with closely spaced points then want to get the average etc for such a large buffer...most/many of which overlap.
- Mark as New
- Bookmark
- Subscribe
- Mute
- Subscribe to RSS Feed
- Permalink
- Report Inappropriate Content
The points are locations from wildlife GPS collars, but I will look into the possibility of dissolving some of the buffers and consolidating areas a bit. Thanks for all your input
- Mark as New
- Bookmark
- Subscribe
- Mute
- Subscribe to RSS Feed
- Permalink
- Report Inappropriate Content
Hi Ryan,
Thanks for bringing up this issue, we hear you!
You can now process overlapping polygons zones in Zonal Statistics as Table tool in ArcGIS Pro 2.5. The zonal analysis will be performed for each individual feature (wildlife GPS collar buffers in this case).
Regards,
Sarmistha