- Home
- :
- All Communities
- :
- Products
- :
- ArcGIS Pro
- :
- ArcGIS Pro Questions
- :
- Hi, I'm starting to learn ArcGis Pro and can't fig...
- Subscribe to RSS Feed
- Mark Topic as New
- Mark Topic as Read
- Float this Topic for Current User
- Bookmark
- Subscribe
- Mute
- Printer Friendly Page
Hi, I'm starting to learn ArcGis Pro and can't figure this one out, I have a csv files with a few fields, building name, the longitude and the latitude, a resale price and a year column to mark the difference in the resale price. So far I have added a lay
- Mark as New
- Bookmark
- Subscribe
- Mute
- Subscribe to RSS Feed
- Permalink
- Report Inappropriate Content
How to add a layer that shows heatmap with resale price.
How to add a time animation to shows the resale price changes throughout the time period.
Table data format:
| HDB Location | Years | Datetime | Average of resale_price | Lon | Lat |
| 1 BEACH ROAD SINGAPORE | 2000 | 1/1/2000 | 178750 | 103.8645218 | 1.3034886 |
| 1 BEACH ROAD SINGAPORE | 2001 | 1/1/2001 | 174166.6667 | 103.8645218 | 1.3034886 |
| 1 BEACH ROAD SINGAPORE | 2002 | 1/1/2002 | 180333.3333 | 103.8645218 | 1.3034886 |
| 1 BEACH ROAD SINGAPORE | 2003 | 1/1/2003 | 201833.3333 | 103.8645218 | 1.3034886 |
| 1 BEACH ROAD SINGAPORE | 2004 | 1/1/2004 | 193000 | 103.8645218 | 1.3034886 |
| 1 BEACH ROAD SINGAPORE | 2005 | 1/1/2005 | 180000 | 103.8645218 | 1.3034886 |
| 1 BEACH ROAD SINGAPORE | 2006 | 1/1/2006 | 222500 | 103.8645218 | 1.3034886 |
| 1 BEACH ROAD SINGAPORE | 2007 | 1/1/2007 | 209500 | 103.8645218 | 1.3034886 |
Thanks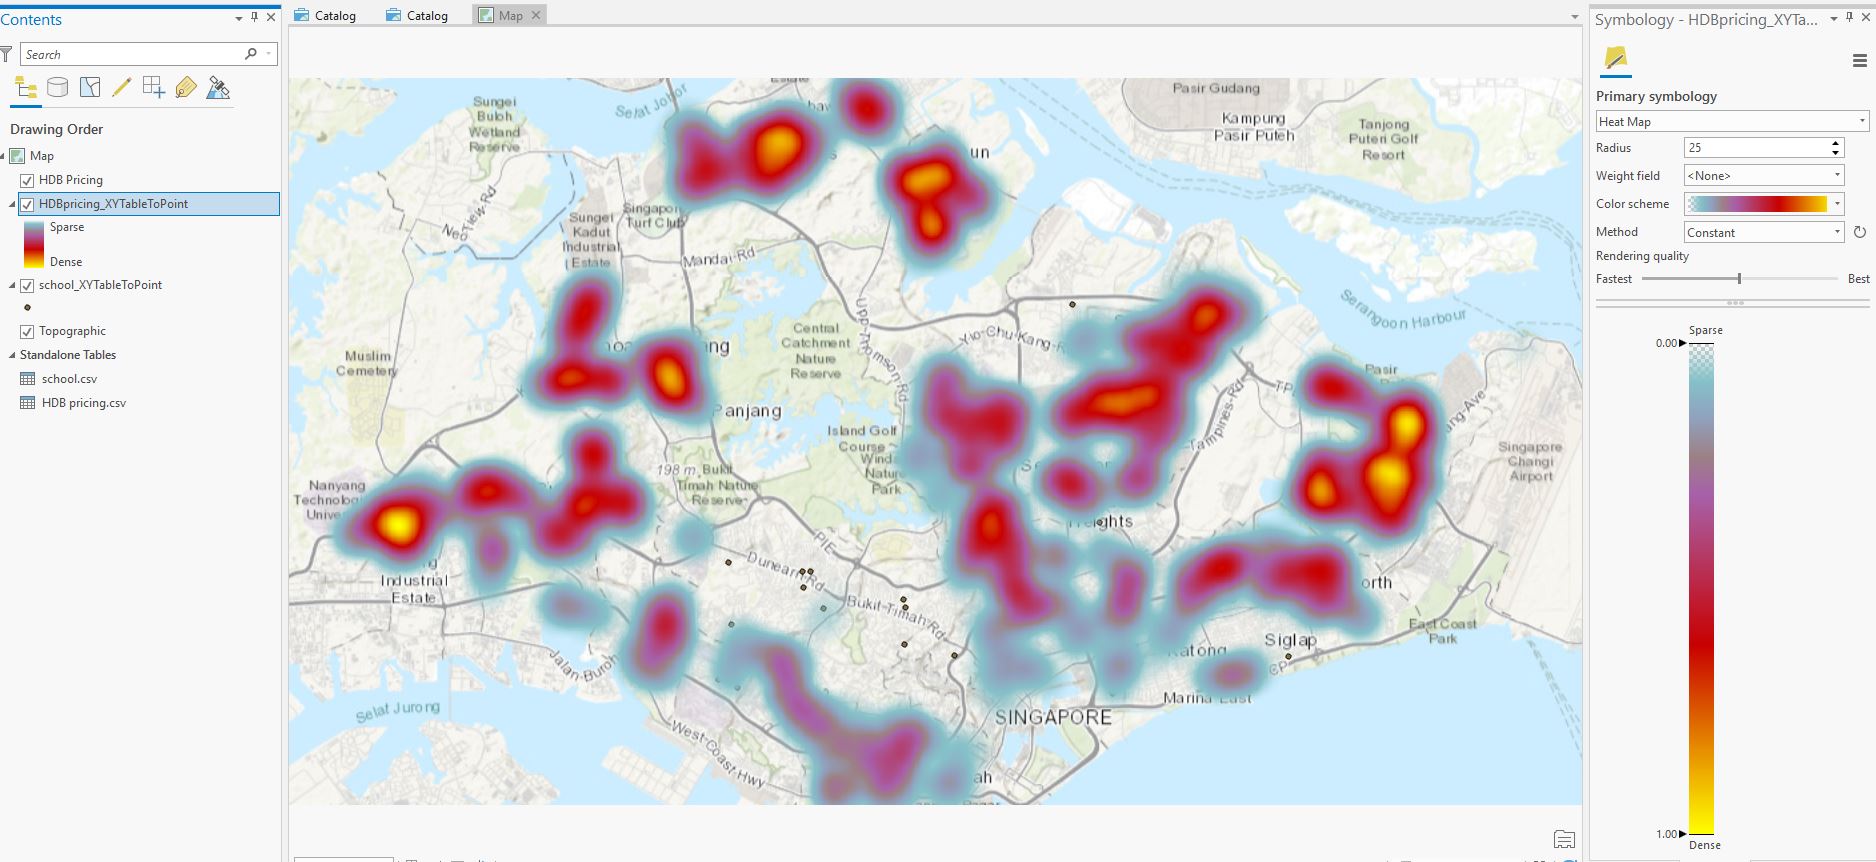
- Mark as New
- Bookmark
- Subscribe
- Mute
- Subscribe to RSS Feed
- Permalink
- Report Inappropriate Content
- Mark as New
- Bookmark
- Subscribe
- Mute
- Subscribe to RSS Feed
- Permalink
- Report Inappropriate Content
For your first question, I think all you need to do is set the Weight field on the Symbology pane to the attribute you want the heat map to represent (average of resale price). This attribute needs to be a numeric field. If it's a text field, you need to add a new field to the table, give it a numeric field type (float, if you need decimal points, otherwise long integer) then do a field calculation to copy the resale values as numbers rather than text strings.
For your second question, you need to know how to enable your layer to display time values. Even before reading the help topic Kory suggested, it would help you a lot to go through the Visualize temporal data tutorial. That will show you how to format your table properly, how to set time properties for your layer, and how to make an animation.
- Mark as New
- Bookmark
- Subscribe
- Mute
- Subscribe to RSS Feed
- Permalink
- Report Inappropriate Content
Hi again, and thanks but I didn't really find the tutorial useful but did find a time related properties in the layer and set that to point to the time column in my csv file.
I try to publish that map to the web but somehow I'm not able to see the same kind of animation.
In the editor the animation is set to dynamic and I'm able to view the changes in the heatmap, but on the web it doesn't show the heatmap changes across time.
Can anyone advise on what's wrong here?
Here's the link to the published web map.
https://www.arcgis.com/home/webmap/viewer.html?webmap=98a07c29b2ec4820bb656e9c46dc5d18
