- Home
- :
- All Communities
- :
- Industries
- :
- Transportation
- :
- Public Transit
- :
- Public Transit Questions
- :
- GTFS Network Analysis from ArcMap to ArcGIS Pro
- Subscribe to RSS Feed
- Mark Topic as New
- Mark Topic as Read
- Float this Topic for Current User
- Bookmark
- Subscribe
- Mute
- Printer Friendly Page
GTFS Network Analysis from ArcMap to ArcGIS Pro
- Mark as New
- Bookmark
- Subscribe
- Mute
- Subscribe to RSS Feed
- Permalink
- Report Inappropriate Content
Hello, I watched and worked along the GTFS tutorials using similar process with different data (NYC) and it worked pretty well. I used ArcMap. Now I am trying to do it in ArcGIS Pro and it's just not the same. I am using the same network dataset created with ArcMap. Should I start from scratch? For example, I have problems with the units, it seems something is not quite there with the cutoffs, when I do Service Area. The Network Dataset Properties window looks only somewhat familiar. Any suggestions regarding the transition to ArcGIS Pro?
Thank you,
Horia.
- Mark as New
- Bookmark
- Subscribe
- Mute
- Subscribe to RSS Feed
- Permalink
- Report Inappropriate Content
Hello Horia. You didn't say which tools you're trying to use.
The Add GTFS to a Network Dataset toolbox and the network datasets created with it are not supported in ArcGIS Pro. If you're trying to use this tool, it won't work at all. The good news is that we are working very hard to make this functionality supported in the next release of ArcGIS Pro.
If you are using the other tools described on this site, they should work in ArcGIS Pro. However, as you've noticed, the workflows and user interface are different from ArcMap. You can find some documentation and several tutorials for Network Analyst in ArcGIS Pro here. There are also some network dataset properties that do not yet appear in the network dataset properties pages. ArcGIS Pro is a newer product that does not yet have all the functionality of ArcMap.
If you have more specific questions about properties or workflows, feel free to post again, and maybe I can answer your questions or point you toward further resources.
- Mark as New
- Bookmark
- Subscribe
- Mute
- Subscribe to RSS Feed
- Permalink
- Report Inappropriate Content
Hello Melinda, Thank you for getting back to me, I'll check those links. As a matter of fact I had, for a while now, a number of questions regarding Network Analysis with GTFS data but I waited to gather more experience and information (including reading your other answers) before posting them. The ArcGIS Pro issue just came up as a requirement to use it for a project, I have been using ArcMap. A little background info: I am ranking sites in NYC using multiple weighted criteria, one of them being proximity to public transit. Originally I approached the issue by creating a 0.3 mile buffer around every site and giving points for how many subway or bus stations are within. Then I started to look into Network Analysis and now I want to use a this workflow/ process.
I'm going to break it down for clarity, sometimes is more of a discussion than a question.
1. Do you think it's OK to mix the use of ArcMap and ArcGIS Pro for the same project? Like, to use the best of each.
2. I created a NYC network dataset consisting only of streets and GTFS data, subway and buses (local and express). The resulting file was 1.6 GB! I then played around with it, doing some Service Area and Route Analysis tests.
Service Area.
In some cases (I created more than one network dataset) there is a discrepancy between the results if I use time (minutes) or distance as Impedance, distance being correct. I might not have set something properly somewhere, I'll go over that again. Any comments regarding troubleshooting?
If I use Default Breaks, the areas closer to the facility are generated with less detail. Can that be changed?
Route
I tried to check the accuracy of the result and I don't know, it's not an easy task. Somehow I thought that one would be able to "see" the route: from point A walk to this bus station, take this bus route to this stop, walk to this subway station, take this subway line to this stop, walk to point B. The route cannot be properly displayed because it follows the created Transit lines. And by using the Network Identify Tool, the result is in "network speak" (Edges 48095 Transit Lines) instead of " subway, Q line, between DeKalb and Canal".
How do you visualize the results?
Can something similar to driving directions be generated?
How much do you trust the results?
Changing the location of the stops I occasionally get this message, without an apparent cause:
Warning: Location "ABC" in "Stops" is on a non-traversable network element position.
Warning: Cannot preserve last location "ABC" in "Stops" because it is invalid.
Error: "Stops" does not contain valid input for any route
How do I troubleshoot this?
3. Regarding my project, on one hand is the accessibility to public transit which in my case will consist of subway, bus and ferry. This would be answering the question What level of transit service does a site have access to? The other would be to analyze the travel time to major areas like Downtown and Midtown Manhattan, where the majority of people commute to work. I can create a service area with 10 breaks, covering the entire city, with 2 facilities (Downtown and Midtown Manhattan) and than assign scores respective to the area where each site is located.
How would you go about it?
Thanks again and all the best.
Horia
- Mark as New
- Bookmark
- Subscribe
- Mute
- Subscribe to RSS Feed
- Permalink
- Report Inappropriate Content
Horia Popa wrote:
Hello Melinda, Thank you for getting back to me, I'll check those links. As a matter of fact I had, for a while now, a number of questions regarding Network Analysis with GTFS data but I waited to gather more experience and information (including reading your other answers) before posting them. The ArcGIS Pro issue just came up as a requirement to use it for a project, I have been using ArcMap. A little background info: I am ranking sites in NYC using multiple weighted criteria, one of them being proximity to public transit. Originally I approached the issue by creating a 0.3 mile buffer around every site and giving points for how many subway or bus stations are within. Then I started to look into Network Analysis and now I want to use a this workflow/ process.
^ A better approach is to use the Origin-Destination Cost Matrix tool instead of Service Area (or Buffer). Rather than using the buffer to identify which transit stations are within the buffer, using the OD Cost Matrix gives you the precise network distance to from each site to each transit stop within your time/distance limit. This is a much more accurate calculation, and you avoid problems with strange Service Area polygons like you mention below. Service Area is more of a visualization tool.
1. Do you think it's OK to mix the use of ArcMap and ArcGIS Pro for the same project? Like, to use the best of each.
Yes, that's fine, although as mentioned previously, the Add GTFS to a Network Dataset tool is not supported in Pro. You might also find some functionality available in ArcMap that is not available in Pro and some newer functionality that is in Pro that is not in ArcMap. Use the best tool, or combination of tools, for the job.
2. I created a NYC network dataset consisting only of streets and GTFS data, subway and buses (local and express). The resulting file was 1.6 GB! I then played around with it, doing some Service Area and Route Analysis tests.
^ By this, I assume you mean you used the Add GTFS to a Network Dataset toolbox. Please clarify because that makes a difference in my advice and the expected behavior. The large file size is not surprising. If you look at the size of the original GTFS data, I imagine it will be similar. New York has a lot of transit. 
Service Area.
In some cases (I created more than one network dataset) there is a discrepancy between the results if I use time (minutes) or distance as Impedance, distance being correct. I might not have set something properly somewhere, I'll go over that again. Any comments regarding troubleshooting?
If your network includes public transit via the Add GTFS to a Network Dataset toolbox, then the travel time includes journeys by public transit. The distance calculation will depend on how you configured your evaluators to calculate distance along the transit lines. Technically, you shouldn't do this at all. The transit lines should be restricted when optimizing based on distance because the transit lines from Add GTFS to a Network Dataset are not representative of the actual paths through the network taken by the transit vehicles. They are a logical connection between connected stops, and the transit evaluator uses the schedules to determine the travel time if you're optimizing based on time.
But, earlier you said you were just trying to find which transit stops were within a certain distance of your potential sites. If that's the case, you don't need the Add GTFS to a Network Dataset tool or the network created with it at all. Networks created with Add GTFS to a Network Dataset allow you to calculate the travel time from one place to another by public transit. So, the travelers are actually walking along the streets, getting on the transit lines and riding, then walking to their destination. If you only need to know which transit stops are within a short walk of your potential sites, then you actually just need a network dataset of streets without the transit in the network. The transit stops in this case would function as destinations in an Origin-Destination Cost Matrix analysis, not part of the network itself.
If I use Default Breaks, the areas closer to the facility are generated with less detail. Can that be changed?
I'm not sure what you mean by this. Can you post a screenshot and clarify what polygon generation settings you're using?
Route
I tried to check the accuracy of the result and I don't know, it's not an easy task. Somehow I thought that one would be able to "see" the route: from point A walk to this bus station, take this bus route to this stop, walk to this subway station, take this subway line to this stop, walk to point B. The route cannot be properly displayed because it follows the created Transit lines. And by using the Network Identify Tool, the result is in "network speak" (Edges 48095 Transit Lines) instead of " subway, Q line, between DeKalb and Canal".
How do you visualize the results?
Can something similar to driving directions be generated?
How much do you trust the results?
Technical limitations in Network Analyst prevent me from being able to show the names and details of the transit lines in Directions and in Network Identify. However, if you solve a Route, you can get some further details about the transit lines used by post-processing the route using the Copy Traversed Source Features (with Transit) tool, which is included in the Add GTFS to a network Dataset download.
I trust that the results are as accurate as the GTFS schedules and the Network Analyst algorithms allow, given the limitations of the tools as described here.
Changing the location of the stops I occasionally get this message, without an apparent cause:
Warning: Location "ABC" in "Stops" is on a non-traversable network element position.
Warning: Cannot preserve last location "ABC" in "Stops" because it is invalid.
Error: "Stops" does not contain valid input for any routeHow do I troubleshoot this?
Your network dataset probably has one or more restriction attributes, and your points are located on parts of the network that are restricted. Consequently, they can't be reached. There's a setting in your network analysis layer properties that can help with that. Info is here.
3. Regarding my project, on one hand is the accessibility to public transit which in my case will consist of subway, bus and ferry. This would be answering the question What level of transit service does a site have access to? The other would be to analyze the travel time to major areas like Downtown and Midtown Manhattan, where the majority of people commute to work. I can create a service area with 10 breaks, covering the entire city, with 2 facilities (Downtown and Midtown Manhattan) and than assign scores respective to the area where each site is located.
How would you go about it?
Take a look at this Story Map for some ideas.
- Mark as New
- Bookmark
- Subscribe
- Mute
- Subscribe to RSS Feed
- Permalink
- Report Inappropriate Content
If I use Default Breaks, the areas closer to the facility are generated with less detail. Can that be changed?
I'm not sure what you mean by this. Can you post a screenshot and clarify what polygon generation settings you're using?
Here is a service area, Default Breaks 10 min, Polygon type Detailed

Here is the same service area, Default Breaks 10 min, Polygon type Detailed, Trim 30 m
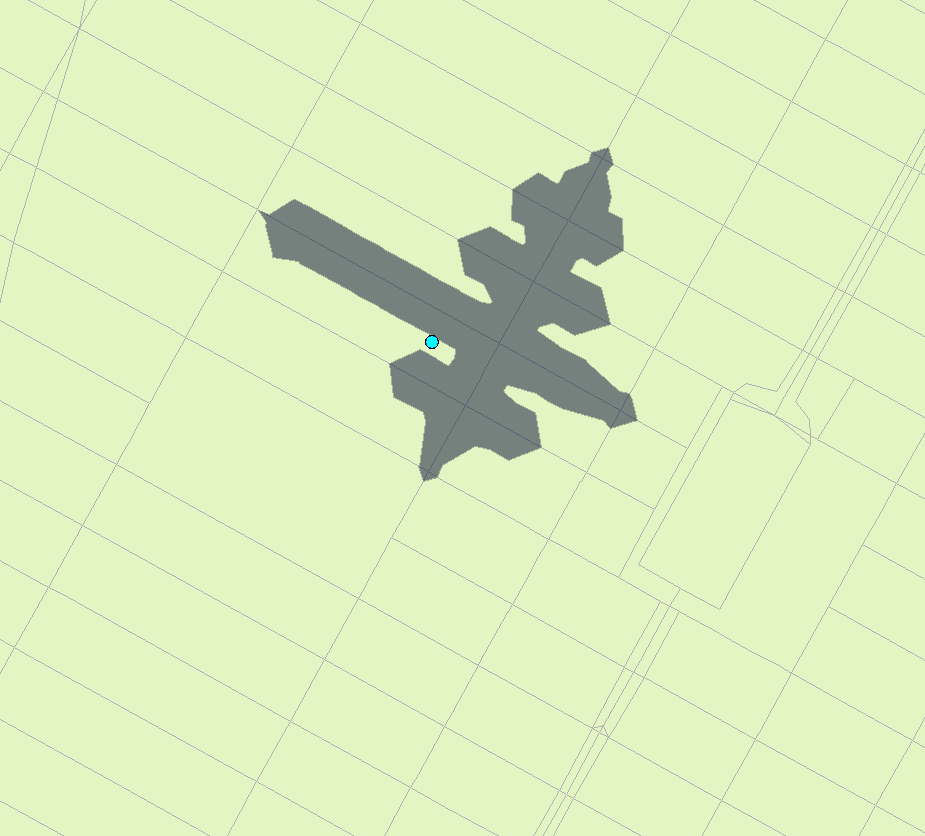
Here is the same service area, Default Breaks 10,20 min, Polygon type Detailed, Trim 30 m.
As you can see the outside polygon (20 min) is indeed trimmed but the 10 min is overly simplified.

A workaround would be to create two separate service areas, instead of using breaks.

It is not a big difference but some points that are within 10 min travel time will fall under the 20 min area.
- Mark as New
- Bookmark
- Subscribe
- Mute
- Subscribe to RSS Feed
- Permalink
- Report Inappropriate Content
Oh, yeah, I know what you're talking about. This is an artifact of the old (ArcMap) detailed polygon generation algorithm and how it interacts with the trim settings. We have improved the way detailed polygons are generated for ArcGIS Pro, so if you solve this same problem in Pro, you'll probably see cleaner results.
This also demonstrates the reason why I suggest using an OD Cost Matrix analysis for applications where you care about determining which locations are within a certain distance of some origin point. It's more accurate and more consistent than overlaying Service Area polygons.
- Mark as New
- Bookmark
- Subscribe
- Mute
- Subscribe to RSS Feed
- Permalink
- Report Inappropriate Content
Hello,
I have a question in connection with the same project, NYC Public Transit Network. In the image bellow, Stop 1 is in Staten Island (one of the boroughs in NYC) and Stop 2 is in Lower Manhattan. I tried to solve for the route at different start times, as well as days and every time I get a route that takes around 60 minutes. From what I see, it's a combination of buses and express buses. However, I know that the ferry ride is only 25 minutes long yet that venue is never used. The edge appears in the Transit lines layer (green in the second image), so I assume that the ferry service was included in the network.
Are there any ways I can check things out?
Thank you,
Horia


- Mark as New
- Bookmark
- Subscribe
- Mute
- Subscribe to RSS Feed
- Permalink
- Report Inappropriate Content
Here are a few possible causes of this problem:
1) The ferry stations are somehow physically disconnected from the rest of the network. Use the Network Identify tool to make sure the ferry lines are connected to stop connectors and the stop connectors are connected to the streets, and those streets are adequately connected to other streets.
2) If they ferry data came from a separate GTFS dataset, make sure the analysis date and time are during a period when the ferries have service. This section of the Troubleshooting Guide might help a little, and keep in mind that the date range needs to work for all input GTFS datasets you used to create the network.
- Mark as New
- Bookmark
- Subscribe
- Mute
- Subscribe to RSS Feed
- Permalink
- Report Inappropriate Content
I am getting this warning during the Generate Transit Lines and Stops. Is this what you mean by #2?
Warning! Your calendar.txt file(s) contain(s) non-overlapping date ranges. As a result, your analysis might double count the number of trips available if you are analyzing a generic weekday instead of a specific date. This is especially likely if the non-overlapping pairs are in the same GTFS dataset. Please check the date ranges in your calendar.txt file(s). See the User's Guide for further assistance. Date ranges do not overlap in the following pairs of service_ids: (Showing the first 10 non-overlaps) [[u'googletransit:BPPB9-BP_B9-Weekday-10-SDon', u'googletransit:FRPA9-FR_A9-Sunday-10'], [u'googletransit:BPPB9-BP_B9-Weekday-10-SDon', u'googletransit:JKPA9-JK_A9-Sunday-10'], [u'googletransit:BPPB9-BP_B9-Weekday-10-SDon', u'googletransit:SCPA9-SC_A9-Sunday-10'], [u'googletransit:BPPB9-BP_B9-Saturday-10', u'googletransit:FRPA9-FR_A9-Sunday-10'], [u'googletransit:BPPB9-BP_B9-Saturday-10', u'googletransit:FRPA9-FR_A9-Weekday-10-SDon'], [u'googletransit:BPPB9-BP_B9-Saturday-10', u'googletransit:JKPA9-JK_A9-Sunday-10'], [u'googletransit:BPPB9-BP_B9-Saturday-10', u'googletransit:JKPA9-JK_A9-Weekday-10-SDon'], [u'googletransit:BPPB9-BP_B9-Saturday-10', u'googletransit:SCPA9-SC_A9-Sunday-10'], [u'googletransit:BPPB9-BP_B9-Saturday-10', u'googletransit:SCPA9-SC_A9-Weekday-10-SDon'], [u'googletransit:CPPB9-CP_B9-Weekday-10-SDon', u'googletransit:FRPA9-FR_A9-Sunday-10']
Anyway, I realized that I was using the latest Ferry GTFS data with older Bus & Subway and this caused the problem. I started again with all the latest data and it works just fine. Thank you!
- Mark as New
- Bookmark
- Subscribe
- Mute
- Subscribe to RSS Feed
- Permalink
- Report Inappropriate Content
Yes, exactly. Glad you got it working!