Turn on suggestions
Auto-suggest helps you quickly narrow down your search results by suggesting possible matches as you type.
Cancel
- Home
- :
- All Communities
- :
- Products
- :
- ArcGIS Pro
- :
- ArcGIS Pro Questions
- :
- Is there a way to automate symbology of rasters to...
Options
- Subscribe to RSS Feed
- Mark Topic as New
- Mark Topic as Read
- Float this Topic for Current User
- Bookmark
- Subscribe
- Mute
- Printer Friendly Page
Is there a way to automate symbology of rasters to show intervals of 1 from the minimum value?
Subscribe
222
0
03-20-2019 01:44 PM
03-20-2019
01:44 PM
- Mark as New
- Bookmark
- Subscribe
- Mute
- Subscribe to RSS Feed
- Permalink
- Report Inappropriate Content
Any wizards out there that can help?
We work a lot with raster data and have to symbolize intervals of 1 from the minimum value of each raster. So if the range of values is 3.3 - 6, the intervals would be 3.3-4.3, 4.3-5.3 and 5.3-6. The result ends up looking something like this.
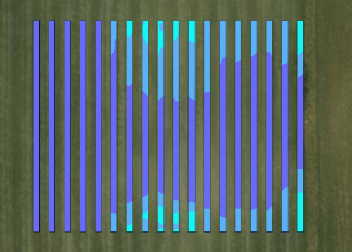
Each column is a different raster and we prefer to symbolize them independently, so the colors are relative to the range of each.
This gets tedious with larger projects. Can anyone help with automation?
Thanks for your time!
0 Replies