- Home
- :
- All Communities
- :
- Services
- :
- Implementing ArcGIS
- :
- Implementing ArcGIS Questions
- :
- Operational Dashboards
- Subscribe to RSS Feed
- Mark Topic as New
- Mark Topic as Read
- Float this Topic for Current User
- Bookmark
- Subscribe
- Mute
- Printer Friendly Page
- Mark as New
- Bookmark
- Subscribe
- Mute
- Subscribe to RSS Feed
- Permalink
- Report Inappropriate Content
Hey everyone,
Right now we are creating am operational dashboard for a project on rest areas and I just want to see what process other people use to show their content in a meaningful way? Let me know!
Best,
Reid Ellis
Solved! Go to Solution.
Accepted Solutions
- Mark as New
- Bookmark
- Subscribe
- Mute
- Subscribe to RSS Feed
- Permalink
- Report Inappropriate Content
You may need to provide is with more information. What type of data are you gathering for the rest area projects?
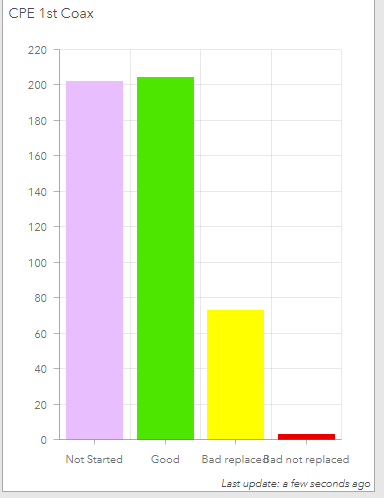
I am managing a project right now where our crews are using collector. The fields I have for them to update on their phones are domained and have 2 to 4 options for the various stages. Most have two choices.
Below is an example of a bar graph for an attribute with 4 possible values
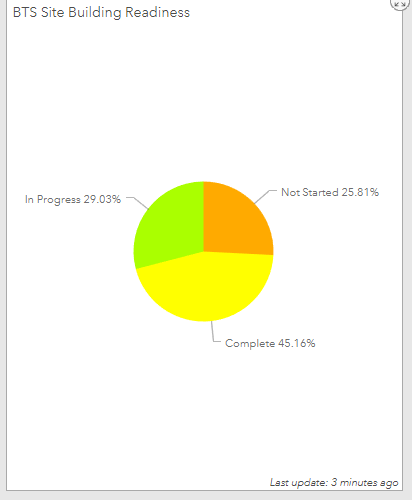
Below is a pie chart of an attribute with 3 possible values
And then a gas gauge for a 2 value attribute
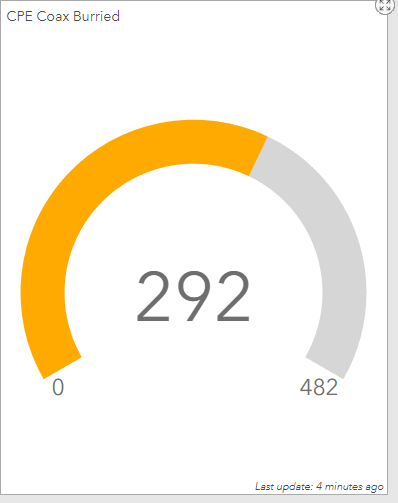 .
.
- Mark as New
- Bookmark
- Subscribe
- Mute
- Subscribe to RSS Feed
- Permalink
- Report Inappropriate Content
You may need to provide is with more information. What type of data are you gathering for the rest area projects?
I am managing a project right now where our crews are using collector. The fields I have for them to update on their phones are domained and have 2 to 4 options for the various stages. Most have two choices.
Below is an example of a bar graph for an attribute with 4 possible values
Below is a pie chart of an attribute with 3 possible values
And then a gas gauge for a 2 value attribute
.
- Mark as New
- Bookmark
- Subscribe
- Mute
- Subscribe to RSS Feed
- Permalink
- Report Inappropriate Content
The manager of the project then asked me for a way to view all photo attachments.
This was set up with multiple with multiple windows and semi complex filters so when a site is selected a window to the left populates with the selected locations showing in one window the site info populated by the field crews and a scroll option to go through the photos.
- Mark as New
- Bookmark
- Subscribe
- Mute
- Subscribe to RSS Feed
- Permalink
- Report Inappropriate Content
We are inspecting assets within the rest areas (e.g sinks, curb ramps, compartment stalls) to see if they are in complaints with ADA standard 2010. So, we created an app in survey 123 following those standards and now are focusing on how we can present our findings. Thanks for the help
- Mark as New
- Bookmark
- Subscribe
- Mute
- Subscribe to RSS Feed
- Permalink
- Report Inappropriate Content
Here's a great blog post from when the new version of Operations Dashboard came out by Derek Law
Some Example Operations Dashboard for ArcGIS Apps & Resources
ArcGIS Blog search: Operations Dashboard