- Home
- :
- All Communities
- :
- Products
- :
- ArcGIS GeoStatistical Analyst
- :
- ArcGIS GeoStatistical Analyst Questions
- :
- Geostatistical Wizard Symbology/Export Class Break...
- Subscribe to RSS Feed
- Mark Topic as New
- Mark Topic as Read
- Float this Topic for Current User
- Bookmark
- Subscribe
- Mute
- Printer Friendly Page
Geostatistical Wizard Symbology/Export Class Breaks Not Honored
- Mark as New
- Bookmark
- Subscribe
- Mute
- Subscribe to RSS Feed
- Permalink
- Report Inappropriate Content
I'm trying to run an interpolation of well measurements using the ArcGIS Pro 2.2.3 Geostatistical Wizard (specifically to interpolate the depth in feet of floating contaminants). I've used the stand-alone IDW tool in both ArcMap and Pro in the past without issue but wanted to try the Geostat Wiz to streamline the process. The interpolation seemed to run fine but the resulting symbology isn't showing correctly: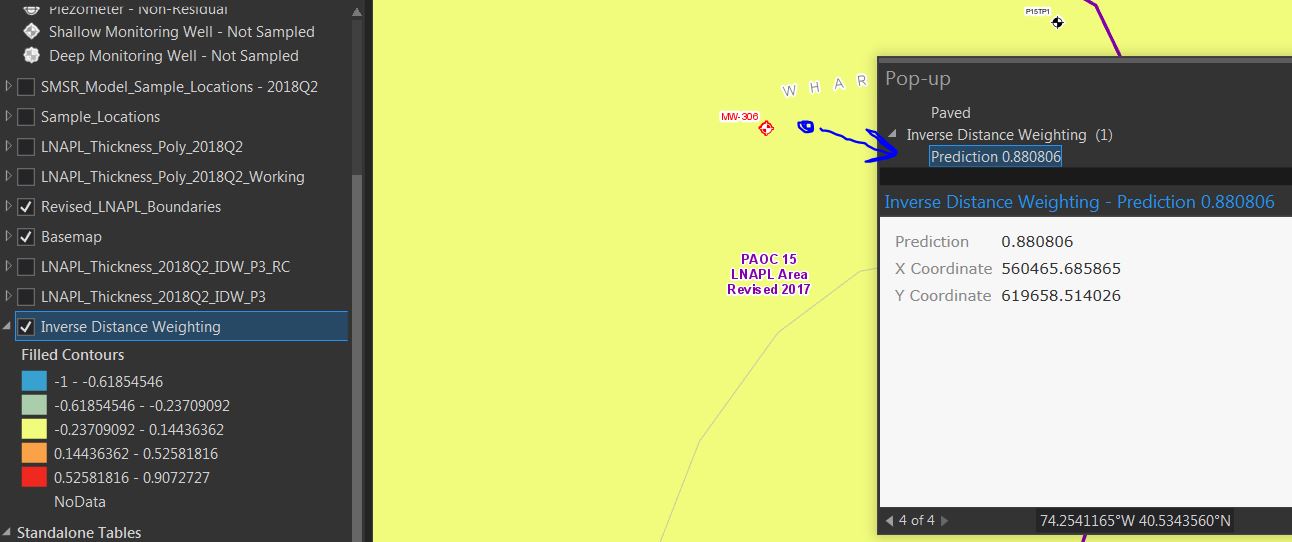
Notice in the screen capture that the identify tool shows the correct interpolated value at the blue dot (0.88) yet the symbology shown for the whole area is the -0.2 to 0.14 class range. When I export to a feature class this problem persists, resulting in useless contours that show much lower values than an exact interpolator like IDW could possibly produce given the input values.
Am I missing a key setting/explanation or is this a bug? I can't see why this behavior would make sense.
*7/26/2019 Update* I'm still seeing this problem in Pro 2.3.2. Has there been any movement to fix this problem in new releases?
*1/24/2020 Update* Pro 2.4.2, still no response or resolution...
- Mark as New
- Bookmark
- Subscribe
- Mute
- Subscribe to RSS Feed
- Permalink
- Report Inappropriate Content
Update: I discovered that when I export the geostatistical layer to a raster it works correctly. This provides a possible workaround, though defeats the purpose of using the geostatistical wizard to save time by creating contour polygons directly instead of creating a raster, reclassifying it, and then running the raster to polygon tool. A fix for successfully exporting the geostatistical layer to contours would save a lot of time & effort.
- Mark as New
- Bookmark
- Subscribe
- Mute
- Subscribe to RSS Feed
- Permalink
- Report Inappropriate Content
perhaps ArcGIS Ideas to see if gains any traction
- Mark as New
- Bookmark
- Subscribe
- Mute
- Subscribe to RSS Feed
- Permalink
- Report Inappropriate Content
It's two versions later and I'm still seeing this behavior in 2.4.2. I tried running the same interpolation in a different project file but saw the same behavior. I'd really like to see an acknowledgement of this by Esri as to whether it is a known bug and if it will be fixed in future releases.
- Mark as New
- Bookmark
- Subscribe
- Mute
- Subscribe to RSS Feed
- Permalink
- Report Inappropriate Content
Did you file a Tech Support case?
https://support.esri.com/en/Search-Results#search?q=geostatistical%20analyst&content-type=Bugs
I couldn't find anything remotely close when querying for "geostatistical analyst" bugs only, and sorted newest to oldest going back at least 3 years.
If it was a case, it either couldn't be replicated or it was situation specific. If it wasn't a filed case, then it can't be dealt with.
- Mark as New
- Bookmark
- Subscribe
- Mute
- Subscribe to RSS Feed
- Permalink
- Report Inappropriate Content
Hi Tim, sorry for the long delay, I am only seeing this question now.
This is going to be a bit of a long answer, but hopefully it will clear up what is happening. To understand this behavior, you need to understand a bit about what a geostatistical layer is. Don't think of it like a feature or raster layer; think of it like a function. It is entirely in-memory and performs on-the-fly calculations at given coordinates. The layer contains references to the input points and the interpolation parameters, and whenever it needs to calculate a value at a location, it calls a function that calculates the value (for example, the Identify tool actually calls the function at the location you click and displays the result of the calculation in the pop-up). In this sense, the geostatistical layer does not even know its own values except at locations where it has already calculated them, which are stored as cache files. The actual contours that you see are generated by contouring a coarse triangular grid behind the scenes, and the contour lines will have lots of imprecision due to the coarseness of the grid. This will often result in predicted values that are on the wrong side of the contour lines, as you're seeing.
Everything about geostatistical layers is optimized for performance and model investigation rather than cartographic correctness. The layers draw very quickly, and the on-the-fly calculations are what allows the layer to, for example, display cross validation results automatically (since the geostatistical layer contains all the references that are needed to perform cross validation).
The contours are only meant to provide a preview of what the surface actually looks like, and they are not intended to be perfectly cartographically correct. When exporting the geostatistical layer to a raster, the function is called at the center of every raster cell and persisted to a raster dataset, so that is the recommended way to display the final result. Using the Contour tool on the exported raster will provide the most analytically correct contour lines, and it is what I would do if I were in your situation.
In the Appearance tab of the geostatistical layer (in the Ribbon above), there is an option for "Presentation." This will use a finer grid for the contours. This will not resolve all problems with values on the wrong sides of the contour lines, but it will reduce them. The presentation option also appears in the GA Layer To Contour tool.
- Mark as New
- Bookmark
- Subscribe
- Mute
- Subscribe to RSS Feed
- Permalink
- Report Inappropriate Content
Thanks for your detailed response Eric; it's helpful to understand how the cogs are working under the surface. I now understand the symbology of the layer and exported contours may not be perfectly precise, but I still believe the amount of inaccuracy I was seeing represents more than just on-the-fly imprecision.
I called Esri after Dan suggested I wouldn't get a resolution otherwise, and sent the rep (Amrik) a copy of the dataset I was working with. He reported seeing the same behavior on his end and wasn't sure what the cause was.
He tried the same workflow with in-house data and couldn't replicate the issue. I then created scratch data with the same value range (-1 to ~1.5) and didn't see the symbology issue, so the problem seems to be related to the specific dataset we work with. The Esri rep said he would try to figure out what about the dataset was causing this issue. I'll report back here if we find a resolution.
Thanks again.
- Mark as New
- Bookmark
- Subscribe
- Mute
- Subscribe to RSS Feed
- Permalink
- Report Inappropriate Content
Hi again Tim,
I talked with support services and took a closer look at your data. While the contouring artifacts are pretty severe in the area of the screenshot, they are due to the issues that I highlighted in my previous post. The reason they are so severe in this area is due to the features with OID 42 and 24. OID 42 has one of the largest measured values in the dataset, and OID 24 has one of the smallest, but they are only ~18.5 feet apart from each other. Since IDW is an exact interpolation method, the surface must pass through the points exactly, so the values of the layer must rapidly change over a very short distance. This distance is actually shorter than the separation distance of the background grid that is used for the contouring, and that is why the contours are struggling to respect the values of the measured points.
I would highly recommend treating the contours of the geostatistical layer as a quick preview of the surface. For analytically robust contours, you should export the geostatistical layer to a raster and contour the raster.
Thanks again for your feedback, and sorry it took so long for you to get a resolution to your problem.
-Eric