- Home
- :
- All Communities
- :
- Products
- :
- ArcGIS Pro
- :
- ArcGIS Pro Questions
- :
- Using a DEM and Flood Accumulation to find Flood P...
- Subscribe to RSS Feed
- Mark Topic as New
- Mark Topic as Read
- Float this Topic for Current User
- Bookmark
- Subscribe
- Mute
- Printer Friendly Page
Using a DEM and Flood Accumulation to find Flood Plains
- Mark as New
- Bookmark
- Subscribe
- Mute
- Subscribe to RSS Feed
- Permalink
- Report Inappropriate Content
I'm trying to complete a school project to build a GIS system, and my group has chosen to try mapping flood plains and we're running in to issues. We've downloaded a DEM off a scholar portal and imported it fine, combined the tiles in to a single DEM raster layer and we thought that by using the Flow Direction tool in Flow Accumulation after that to generate places where water could accumulate. In doing this however, we get a messy looking output file for flow accumulation that looks like little lightning bolts all across the map. The Flow Direction tool looks to have outputted our data OK, as it looks similar to a topographical map in a way. I'd have expected that we'd see some kind of solid areas in the flow accumulation output notably near rivers and lakes and such. Can anyone provide any input in to this and any suggestions as to how we could fix it? It would be much appreciated. Thanks in advance!
Solved! Go to Solution.
Accepted Solutions
- Mark as New
- Bookmark
- Subscribe
- Mute
- Subscribe to RSS Feed
- Permalink
- Report Inappropriate Content
For a start, here's a diagram from an earlier version of ArcGIS Desktop which is helpful in understanding the whole process (I believe the process steps are still the same in ArcGIS Pro). I am not a floodplain expert, but I have done some modelling, so this may be of help.
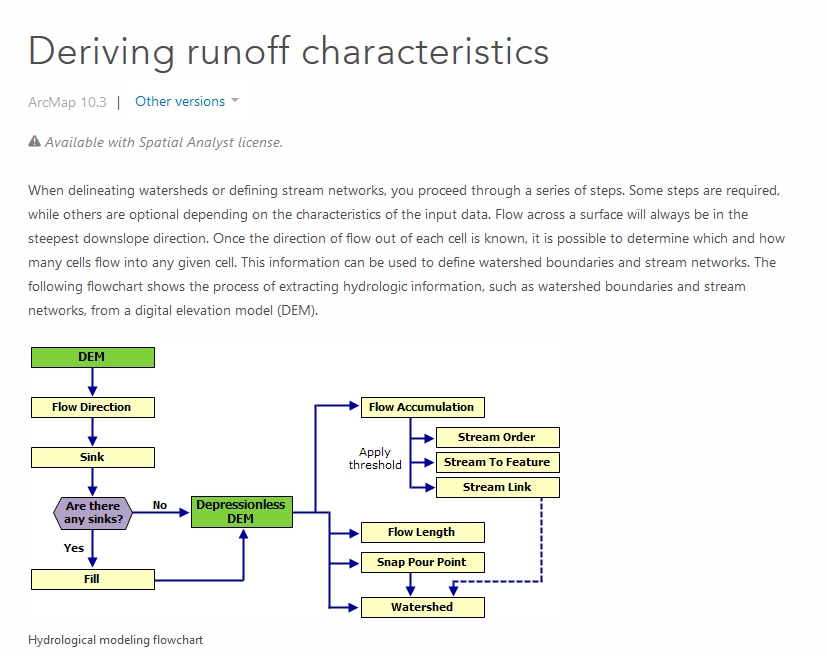
Source: Deriving runoff characteristics—Help | ArcGIS for Desktop
Also, besides the above process, there can be some confounding issues that interfere with outputting a nice neat result. For example, the Digital Elevation Model (DEM) may not be a fine enough resolution to discern where the streambanks are, or other constraining influences. Likewise, a bridge may be represented in the DEM as a solid obstruction when in reality there is a location where the water flows below it. Pipes and diversion ditches may also influence the result, yet not be discerned.
So data cleanup is often a necessary step. All these unwanted issues need to be identified and then remedied. One common remedy is to "burn in" the proper morphology into the cells where the DEM misinterrprets the reality. For example, one could use Raster Calculator to do a subtraction on a cell where a bridge was recorded as a full feature to create the "gap" for the water to pass through.
Also, the settings used in some of the specific tools can affect the outcome. For example, you results can vary tremendously depending on how the Sink-filling is handled. Flow Accumulation is another one where the setting chosen (Expression setting) will produce different results depending on what is chosen.
Anyways, I would start with evaluating your process first. Ensure all the needed steps are being done. Expect to run several iterations as the settings are adjusted to find the most representative outcome.
Also, probably more than you want to know, Floodplain mapping can get very complex (there are folks here on GeoNet who do complex modelling of Floodplains). For example:

ESRI International Users Conference 2018 Demo by ESRI Staff - 3D Water Surface Elevation Modeling
Good luck with your project,
Chris Donohue, GISP
- Mark as New
- Bookmark
- Subscribe
- Mute
- Subscribe to RSS Feed
- Permalink
- Report Inappropriate Content
You need to run Fill Sinks, first.
- Mark as New
- Bookmark
- Subscribe
- Mute
- Subscribe to RSS Feed
- Permalink
- Report Inappropriate Content
For a start, here's a diagram from an earlier version of ArcGIS Desktop which is helpful in understanding the whole process (I believe the process steps are still the same in ArcGIS Pro). I am not a floodplain expert, but I have done some modelling, so this may be of help.
Source: Deriving runoff characteristics—Help | ArcGIS for Desktop
Also, besides the above process, there can be some confounding issues that interfere with outputting a nice neat result. For example, the Digital Elevation Model (DEM) may not be a fine enough resolution to discern where the streambanks are, or other constraining influences. Likewise, a bridge may be represented in the DEM as a solid obstruction when in reality there is a location where the water flows below it. Pipes and diversion ditches may also influence the result, yet not be discerned.
So data cleanup is often a necessary step. All these unwanted issues need to be identified and then remedied. One common remedy is to "burn in" the proper morphology into the cells where the DEM misinterrprets the reality. For example, one could use Raster Calculator to do a subtraction on a cell where a bridge was recorded as a full feature to create the "gap" for the water to pass through.
Also, the settings used in some of the specific tools can affect the outcome. For example, you results can vary tremendously depending on how the Sink-filling is handled. Flow Accumulation is another one where the setting chosen (Expression setting) will produce different results depending on what is chosen.
Anyways, I would start with evaluating your process first. Ensure all the needed steps are being done. Expect to run several iterations as the settings are adjusted to find the most representative outcome.
Also, probably more than you want to know, Floodplain mapping can get very complex (there are folks here on GeoNet who do complex modelling of Floodplains). For example:
ESRI International Users Conference 2018 Demo by ESRI Staff - 3D Water Surface Elevation Modeling
Good luck with your project,
Chris Donohue, GISP
- Mark as New
- Bookmark
- Subscribe
- Mute
- Subscribe to RSS Feed
- Permalink
- Report Inappropriate Content
You might take a look at the Find Areas at Risk of Flooding in a Cloudburst lesson on Learn ArcGIS. This is a tutorial on mapping flood risk under specific conditions (sudden catastrophic downpours). The author is a professor at the University of Copenhagen. The lesson is ArcMap-based, but as Chris said, the process should be the same in Pro. The tutorial data includes geoprocessing models--that helps to visualize the workflow. Anyway, it's one good starting point. It's a complicated game, as Chris also pointed out.