- Home
- :
- All Communities
- :
- Products
- :
- ArcGIS GeoStatistical Analyst
- :
- ArcGIS GeoStatistical Analyst Questions
- :
- Extraction of Data in a Semivariogram
- Subscribe to RSS Feed
- Mark Topic as New
- Mark Topic as Read
- Float this Topic for Current User
- Bookmark
- Subscribe
- Mute
- Printer Friendly Page
Extraction of Data in a Semivariogram
- Mark as New
- Bookmark
- Subscribe
- Mute
- Subscribe to RSS Feed
- Permalink
- Report Inappropriate Content
Hello,
I apologize if these are too simple of questions, but I had two questions regarding semivariograms:
1) When setting up Kriging with the Geostatistical Wizard, a semivariogram is drawn. Is it possible to create this graph without setting up a Kriging run (I just want the graph, not the Kriging layer). "Semivariogram/Covariance Cloud" does not appear to be the same thing.
2) Can you extract the XY data from this semivariogram (into a tabular format)? You can "right click -> copy" the graph, but that simply saves the image and not the data.
Thank you.
- Mark as New
- Bookmark
- Subscribe
- Mute
- Subscribe to RSS Feed
- Permalink
- Report Inappropriate Content
Hi Eliseos,
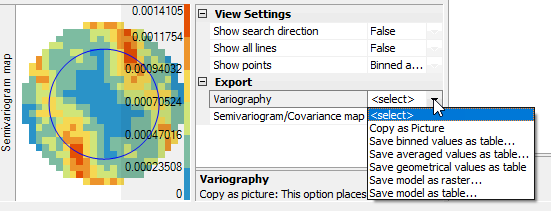
The only available options for exporting the semivariogram are available in ArcMap. On the semivariogram page, there is a section to the right of the semivariogram map with options to export the variography. These options only appear in the user interface of the Geostatistical Wizard, so the process unfortunately cannot be automated.
If these options are something you would find useful in ArcGIS Pro, you should put your idea up on the ArcGIS Ideas site.
-Eric
- Mark as New
- Bookmark
- Subscribe
- Mute
- Subscribe to RSS Feed
- Permalink
- Report Inappropriate Content
Thank you for your quick response. I've now found the export option you described, and it is exactly what I was looking for.
It is unfortunate that this process cannot be automated, as the purpose of this task was to find the best way to compare two kriging layers in an automated fashion. I will have to find a different way to do this.
- Mark as New
- Bookmark
- Subscribe
- Mute
- Subscribe to RSS Feed
- Permalink
- Report Inappropriate Content
The export options allow you to export the blue crosses and red points that you see in the semivariogram pane. That is one way to compare semivariograms, but there are others. There are several methods, for example, to extract the semivariogram parameters (range, nugget, sill, etc) as well as cross-validation and validation statistics.