- Home
- :
- All Communities
- :
- User Groups
- :
- Web AppBuilder Custom Widgets
- :
- Questions
- :
- Related Table Charts (Can't select table)
- Subscribe to RSS Feed
- Mark Topic as New
- Mark Topic as Read
- Float this Topic for Current User
- Bookmark
- Subscribe
- Mute
- Printer Friendly Page
Related Table Charts (Can't select table)
- Mark as New
- Bookmark
- Subscribe
- Mute
- Subscribe to RSS Feed
- Permalink
- Report Inappropriate Content
Hi,
I want to create a lithology chart for every points (borehole) on map. I've tried using ArcGIS Pro's pops up chart, but there's a lot of problems and limitations? (Please advise if I am wrong, I will post the issue in another group)
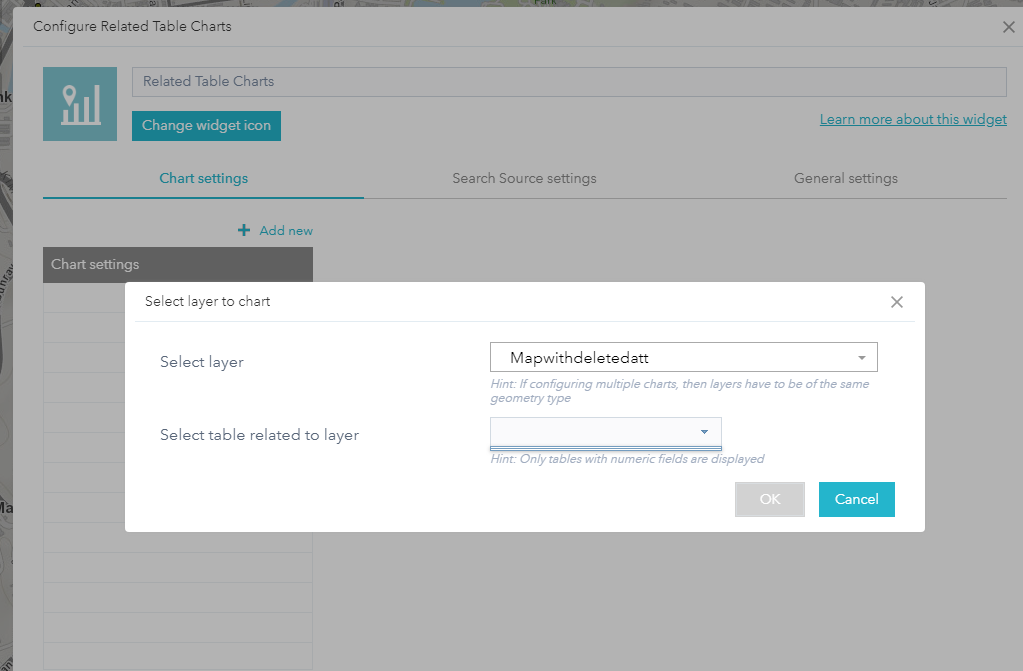
Then, I turn to Related Table Charts widget as the data are to be published on ArcGIS Portal. But in the widget configuration, I can't select a table related to layer (See image). I thought maybe widget doesn't accept widget with non-numeric fields (indicated below), so I deleted all the non-numeric fields. But still the same, can't select a table.
I've created the layer in ArcGIS Pro by relating the two dataset.

I want to create something like this.
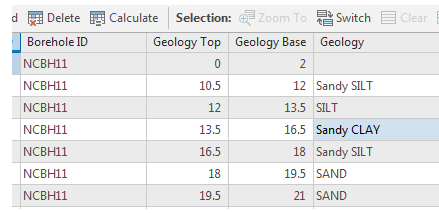
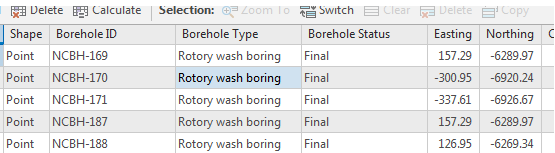
My data (Borehole ID as Primary key)
Left: Type: Table Right: Feature class
Please advice if there's any alternatives other than this widget.
Thanks,
Johana
- Mark as New
- Bookmark
- Subscribe
- Mute
- Subscribe to RSS Feed
- Permalink
- Report Inappropriate Content
Hi,
If you check your service in ArcGIS Server, do you see below 'query related records'?
- Mark as New
- Bookmark
- Subscribe
- Mute
- Subscribe to RSS Feed
- Permalink
- Report Inappropriate Content
Did you ever find a resolution to this issue? I'm encountering the same problem. I have setup relationships in both the service and at the geodatabase level. The map is being created in ArcGIS Pro. Maybe I need to create the service in desktop?
- Mark as New
- Bookmark
- Subscribe
- Mute
- Subscribe to RSS Feed
- Permalink
- Report Inappropriate Content
I solved this doing the following:
- Ensure the feature layer (FL) and table have a GDB relationship class:
- In ArcGIS Pro, make sure the FL and table are in the same GDB
- Right-click GDB > New > Relationship Class and follow prompts as applicable
- From Pro, upload the FL and table *together* using Share as Web App
- In AGOL (or Portal), create a new web map using the uploaded FL-table pair
- Create a new Web App using the web map as the map
- Add a Related Charts Table Widget per the linked instructions.
- The issue of the related table not appearing in the drop-down menu should be resolved!
- ***Note, the FL and table must have that table relationship class pre-made in Pro in order to use this widget***