- Home
- :
- All Communities
- :
- Products
- :
- ArcGIS Spatial Analyst
- :
- ArcGIS Spatial Analyst Questions
- :
- How to count the adjacent cells that have a differ...
- Subscribe to RSS Feed
- Mark Topic as New
- Mark Topic as Read
- Float this Topic for Current User
- Bookmark
- Subscribe
- Mute
- Printer Friendly Page
How to count the adjacent cells that have a different value in a raster dataset?
- Mark as New
- Bookmark
- Subscribe
- Mute
- Subscribe to RSS Feed
- Permalink
- Report Inappropriate Content
Hi,
I'm using a raster dataset and I'm trying to determine a value for land use adjacency as used by Stathakis & Tsilimigkas (2014) (Measuring the compactness of European medium-sized cities by spatial metrics based on fused data sets. International Journal of Image and Data Fusion, 6(1), 42-64. doi:10.1080/19479832.2014.941018)
This involves counting the number of adjacent cells that have a value different to the centre cell. The attached image illustrates this concept.
It needs to return a new raster dataset where the value of each cell equals this count.
Can anyone suggest a method for doing this in ArcMap 10?
Thank you!
EDIT:
Dan, you're an absolute legend! Amazing dedication and perseverance to assist a total stranger on the other side of the world. Thank you so much for all your effort on this!
Just to update, the main issues experienced had much to do with a combination of differences in arcmap 10.3's and ArcGIS Pro's arcpy, and some major changes in numpy that is used by python 2.7 and python 3.6. Dan worked through them and ended up producing the Toolbox/Script I've attached to this edited post. As a final tip, make sure you run the script in a blank dataframe. You will need to manually set the projection of the final output.
- Mark as New
- Bookmark
- Subscribe
- Mute
- Subscribe to RSS Feed
- Permalink
- Report Inappropriate Content
Focal Statistics—Help | ArcGIS Desktop using variety
….if you are using arcmap or ArcGIS pro (need spatial analyst extension)
numpy if you need more than the number of different values within the neighborhood (ie count by the different classes)
- Mark as New
- Bookmark
- Subscribe
- Mute
- Subscribe to RSS Feed
- Permalink
- Report Inappropriate Content
Thanks Dan,
That's the tool I was looking for!
Doesn't quite get there though as I'm looking for a count of the number cells in the neighborhood that are different to the centre cell. The VARIETY statistics type only tells me the count of the unique values (which would also include the value of the centre cell).
Not sure what you mean by numpy? Do you mean this: NumPy — NumPy ? I've never used it before, are you aware of any useful guides that would help with what I'm trying to do?
- Mark as New
- Bookmark
- Subscribe
- Mute
- Subscribe to RSS Feed
- Permalink
- Report Inappropriate Content
I think this is what you want.
Don't worry about how I got it for now, but it uses a moving/sliding 3x3 window on a "raster" as an array
See if this is what you really want...
# ---- consider this small 'raster'
input array
[[1 5 2 1 2 5]
[3 5 3 3 6 6]
[3 9 8 5 1 3]
[1 5 8 4 9 8]
[4 7 3 8 4 2]
[0 9 8 4 4 6]]
# ---- produce a moving/rolling version using a 3x3 kernel
# the first row only...
strided array... first block
[[[1 5 2]
[3 5 3]
[3 9 8]]
[[5 2 1]
[5 3 3]
[9 8 5]]
[[2 1 2]
[3 3 6]
[8 5 1]]
[[1 2 5]
[3 6 6]
[5 1 3]]]
# ---- look at them individually and calculate the 'statistic'
sub array
[[1 5 2]
[3 5 3]
[3 9 8]] ... number different than 5 ... 7
sub array
[[5 2 1]
[5 3 3]
[9 8 5]] ... number different than 3 ... 7
sub array
[[2 1 2]
[3 3 6]
[8 5 1]] ... number different than 3 ... 7
sub array
[[1 2 5]
[3 6 6]
[5 1 3]] ... number different than 6 ... 7
# ---- continue on
- Mark as New
- Bookmark
- Subscribe
- Mute
- Subscribe to RSS Feed
- Permalink
- Report Inappropriate Content
Yep, that's it!
- Mark as New
- Bookmark
- Subscribe
- Mute
- Subscribe to RSS Feed
- Permalink
- Report Inappropriate Content
Ok.. before we get to using numpy, see if you can use the focal statistics variety with an irregular neighborhood
NbrIrregular—Spatial Analyst module | ArcGIS Desktop
effectively you need a kernel file of form
3 3
1 1 1
1 0 1
1 1 1
KernelFile | The irregular inKernelFile is an ASCII text file that defines the shape of an irregular neighborhood. A value of 0 for a cell position indicates that the cell is not a member of the neighborhood, and a nonzero number at a corresponding cell's position indicates that the cell value be included as a member of the neighborhood. | File |
which should blot out the core/focal cell
See
Focal Statistics—Help | ArcGIS Desktop
So as an example from PRO
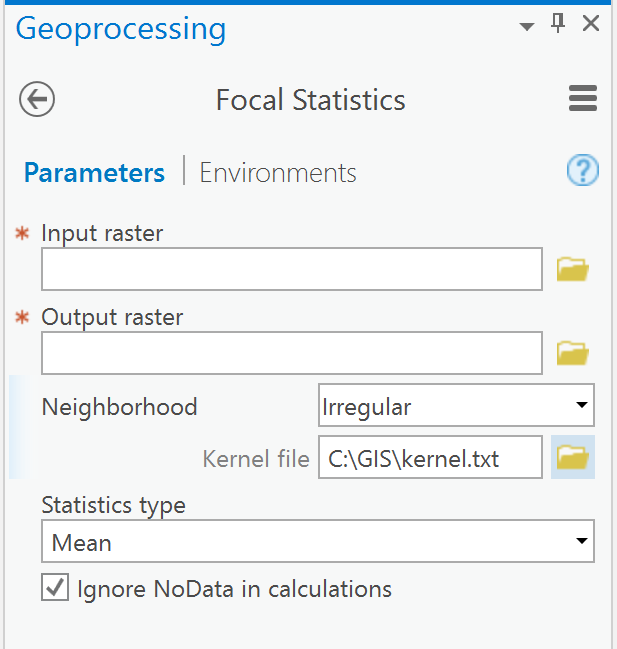
I spent an inordinate amount of time making the kernel file to save you some time 
Give the standard tool with the irregular kernel a shot otherwise I will have to put a short script together for you
PS, statistics type should be variety... didn't have any rasters to test on.. that is your job
- Mark as New
- Bookmark
- Subscribe
- Mute
- Subscribe to RSS Feed
- Permalink
- Report Inappropriate Content
Thank you so much for your help Dan, I really appreciate the effort! The kernal is working well in terms of selecting the right neighbourhood, however the statistics aren't. I was thinking of using the annulus to do this, but your idea is more precise.
Basically this is because I need the count of the surrounding cells that are different to the centre cell. The VARIETY statistics option only counts number of unique values. Also, it's currently counting cells that are the same as the centre cell.
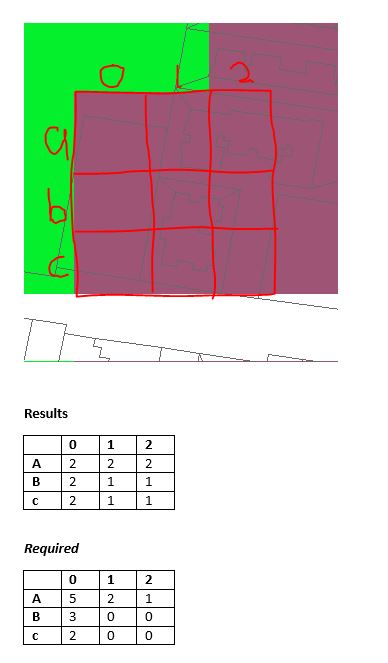
The crudely drawn attached image demonstrates the current results vs. what I require. The underlying image is an extract of my raster data.
The Results table show the results returned by the Focal Stats tool for the grid I've drawn in red.
The Required table shows the results I would expect using the method described by Stathakis & Tsilimigkas.
- Mark as New
- Bookmark
- Subscribe
- Mute
- Subscribe to RSS Feed
- Permalink
- Report Inappropriate Content
so the kernel is basically calculating for 1 cell. with the image you showed above, you have no difference in the values around the kernel/core cell... so cell B1 is giving you 1, where as it should give you 0.
But!!! a variety of 1, implies no variation since the core cell is assigned 0... it may be as simple subtracting 1 from the focal statistics.
Cells b1 to C2 support this, but if you are showing results from the edge of a raster all bets are off since some form of edge fudging may be occurring.
If you could zip and attach a small raster *tif for further inspection, I can look deeper and produce numpy variants like I have shown before... so make sure that those are good... but do the assessment a couple of cells in from edges.
- Mark as New
- Bookmark
- Subscribe
- Mute
- Subscribe to RSS Feed
- Permalink
- Report Inappropriate Content
I don't think just subtracting will work as it's not going to capture what I show in in cells A0 & B0.
The sample I provided above isn't from the edge, it's from the centre of the raster (there are spots throughout that have no data (typically from roads), and this is intentional. Idea is for areas of no data to be ignored.
Please find a sample attached as requested.
- Mark as New
- Bookmark
- Subscribe
- Mute
- Subscribe to RSS Feed
- Permalink
- Report Inappropriate Content
A0 is surrounded by 5 green and 2 reddish... It's variety is 2, the 'required' version is the frequency count like I showed in one of my numpy examples.
Soooo it sounds like you want the variety (2) but the count for the classes making up the one that is 'different' from the core/focal cell.
That is doable, but if you could articulate the algorithm, I can implement it in numpy...
all that is needed is a sample (small) raster zipped and attached to your original thread for testing. You can do hand calculations, and I can run through variants oke the ones I have shown.