- Home
- :
- All Communities
- :
- Products
- :
- Mapping
- :
- Mapping Questions
- :
- How can I symbolize my data based on a field in a ...
- Subscribe to RSS Feed
- Mark Topic as New
- Mark Topic as Read
- Float this Topic for Current User
- Bookmark
- Subscribe
- Mute
- Printer Friendly Page
How can I symbolize my data based on a field in a related table
- Mark as New
- Bookmark
- Subscribe
- Mute
- Subscribe to RSS Feed
- Permalink
- Report Inappropriate Content
I have a sewer manhole feature that is related to a manhole inspections table. I would like to symbolize the feature using a field in the related table.
I cannot see of a way to go this in the symbology tab of the feature properties dialogue box.
- Mark as New
- Bookmark
- Subscribe
- Mute
- Subscribe to RSS Feed
- Permalink
- Report Inappropriate Content
Some questions to try and clear up some doubts:
- What cardinality do you have between the features and the table: is it 1:1 or 1:n or m:n?
- What data would you like to visualize? (numeric or categorical or something else)
- How would you like to visualize it? (statistical aggregation of numeric data in case of 1:n or perhaps a predominant value of categorical data in case of 1:n)
- Mark as New
- Bookmark
- Subscribe
- Mute
- Subscribe to RSS Feed
- Permalink
- Report Inappropriate Content
The related table is 1:M relationship that I would like to symbolize by a field called "Inspected". This is just a text field that only contains yes or no text.
This are the properties.
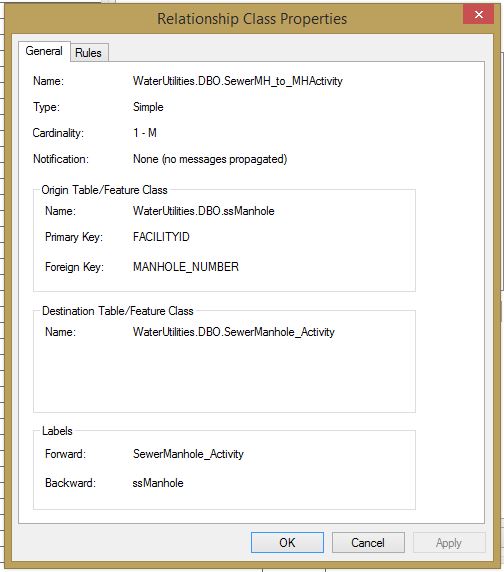
I just want to be able to show the inspected manholes in green and the others on red but in the symbology tab if I choose to symbolize by category I do not have access to the fields in the related table.
Thanks
- Mark as New
- Bookmark
- Subscribe
- Mute
- Subscribe to RSS Feed
- Permalink
- Report Inappropriate Content
The fact that you have 1:M cardenality could mean that a single manhole could have multiple values for the field inspected. Is that the case? If so, how would you want to visualize that?
- Mark as New
- Bookmark
- Subscribe
- Mute
- Subscribe to RSS Feed
- Permalink
- Report Inappropriate Content
Yes that is the case. This is a collector app for our sewer field inspection crew. They just need to be able to see which manholes they have or have not inspected. So I guess there could be more than one inspection on a manhole but it may have "yes" in the inspected field multiple times if they have inspected it more than once.
Sounds like I might have to place this field in the feature table instead of the related table.
- Mark as New
- Bookmark
- Subscribe
- Mute
- Subscribe to RSS Feed
- Permalink
- Report Inappropriate Content
My recommendation would be to put a field in the feature table. I would also use a domain with values that would suggest what types of maintenance is required: "None, Inspection, Service, Replacement, etc." You can then symbolize on this field. When the crew has completed the inspection, they select "None" and the symbol changes to the default.
- Mark as New
- Bookmark
- Subscribe
- Mute
- Subscribe to RSS Feed
- Permalink
- Report Inappropriate Content
I agree with Randy Burton . It would be better to send the workers into the field with a field that initially will say that a manhole needs to be inspected. The field worker can set it to "inspected" or perhaps even "maintenance required" or something similar and draw the geometries on that field to have a visual indication of what still needs to be done. This is also better in case you want to configure a dashboard and show some metrics. It is better to have that status at the feature level and not (only) in the related table.
- Mark as New
- Bookmark
- Subscribe
- Mute
- Subscribe to RSS Feed
- Permalink
- Report Inappropriate Content
Thanks to everyone for their help. I will move my inspected field to the feature table as suggested.
- Mark as New
- Bookmark
- Subscribe
- Mute
- Subscribe to RSS Feed
- Permalink
- Report Inappropriate Content
Neil,
I just finished creating a model which symbolizes SMH Inspections based on when the inspection was entered into the related table. It is based on a field in the SMH Feature, exactly like what Randy was talking about above, but joined to the Inspection Table and run using a Python script in Windows Task Scheduler. I populate that field with a "Yes" to indicate it was inspected within the last month (Green Diamond), which is hidden and not editable by field staff. When a month elapses, the yes will change back to <Null> and the symbology will change back to a Red Diamond.
This is the basic outline:
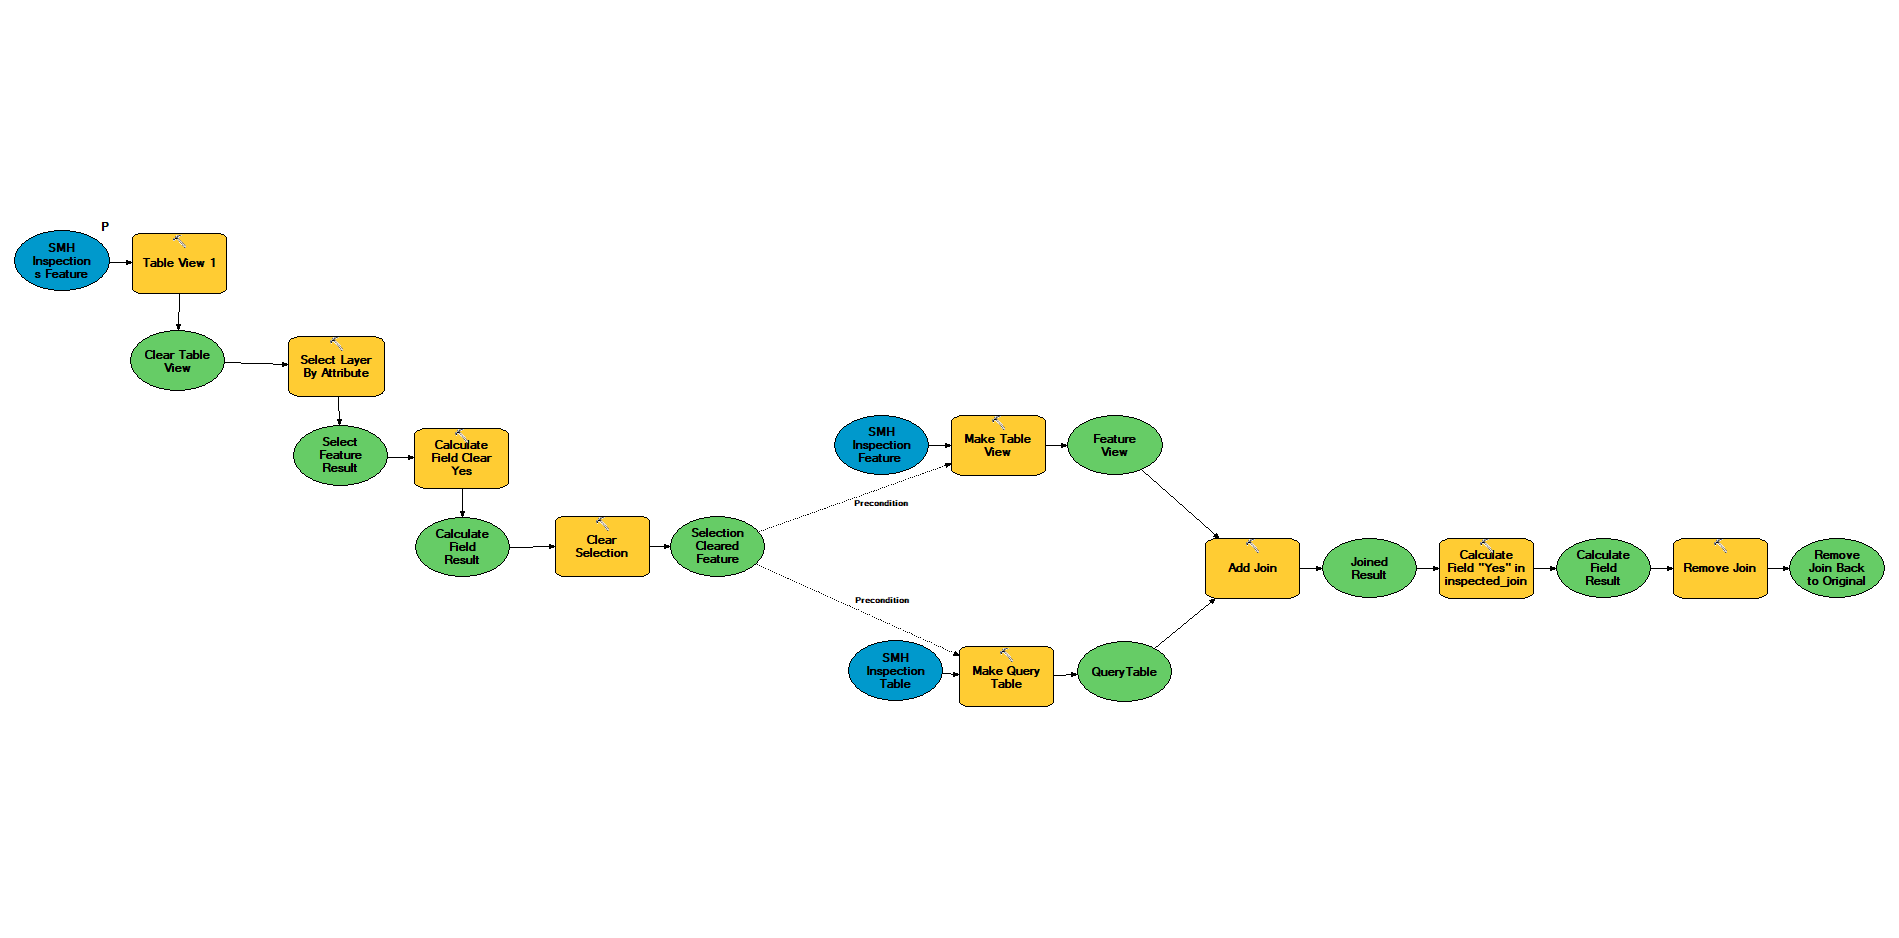
The first 4 tools clear any of the existing "Yes"(s) in the Feature Class and allow it to be populated with the most recent data.
You then join the SMH Inspection FC and the Inspection Table. You MUST make the FC a Table View first however, or the tool will not run when called in Python.
The Inspection Table must be made into a Query Table so you can pull the records within the last month. Here's what that looks like:
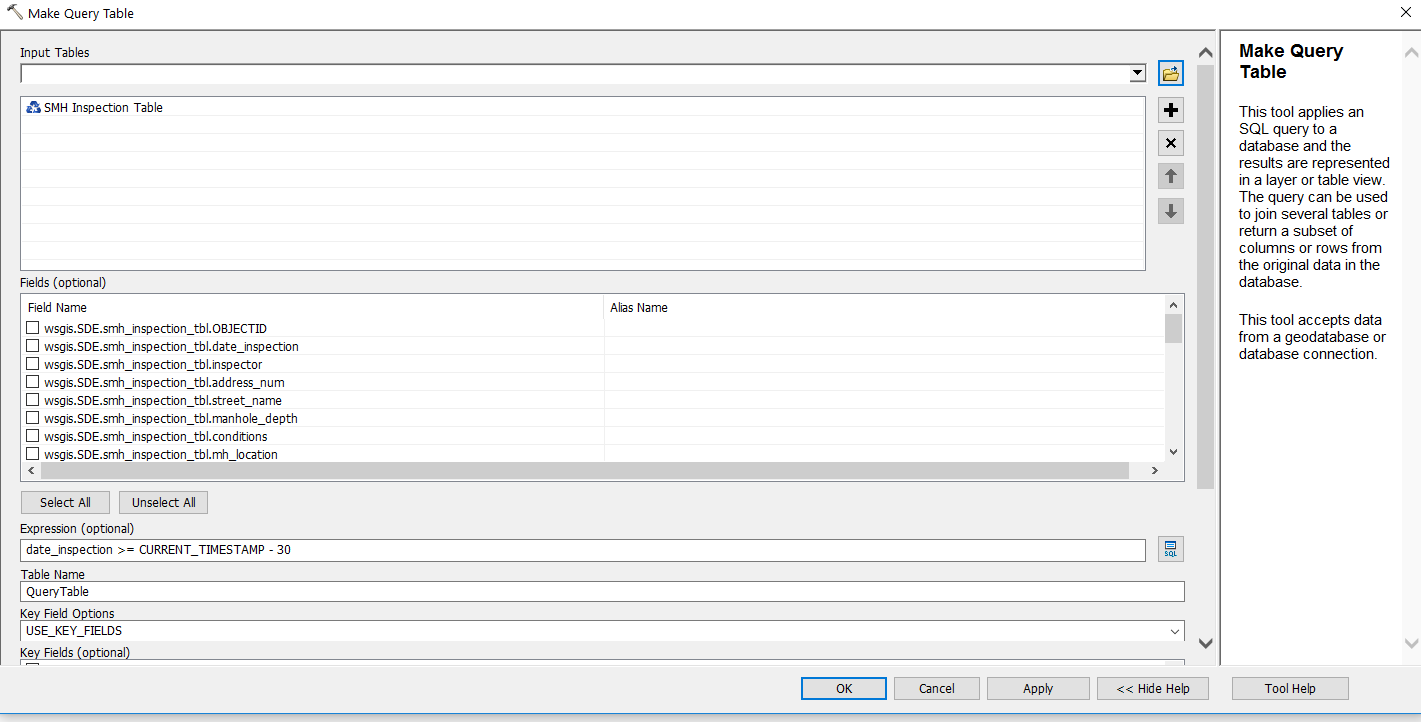
Make sure to enter in the time you want in the Expression. I will ultimately use the 'created_date' field. This will pull all records in the last 30 days.
Then Join to the FC Table View and keep only matching records.
Field Calculate the designated field in the FC with a value (Yes for me)
Remove the Join.
In order to get this to run automatically, open IDLE and enter the following:
import arcpy
#Copy Toolbox Path Properties>Location
arcpy.ImportToolbox("C:\Users\USER NAME\AppData\Roaming\ESRI\Desktop10.5\ArcCatalog\DATABASE NAME.sde\TOOLBOX NAME (do not include .tbx)")
#Copy FC Path Properties>Name, You must assign an Alias to the Toolbox
arcpy.ToolboxALIAS.ModelName("C:\Users\USER NAME\AppData\Roaming\ESRI\Desktop10.5\ArcCatalog\DATABASE NAME.sde\FEATURE CLASS NAME")
#This is the first parameter at the beginning of the model
#You may need to change the backslashes to forward slashes
print "Completed"
Run at your convenience with Windows Task Scheduler.
I know this is more than what you want so you can definitely eliminate the time part of it if you just want to see that it was inspected at some point. I just put this all together since others may find it useful and I literally just finished it so it's still fresh in my mind.
Fred