- Home
- :
- All Communities
- :
- Industries
- :
- Telecommunications
- :
- Telecommunications Questions
- :
- is ArcGIS what I need
- Subscribe to RSS Feed
- Mark Topic as New
- Mark Topic as Read
- Float this Topic for Current User
- Bookmark
- Subscribe
- Mute
- Printer Friendly Page
is ArcGIS what I need
- Mark as New
- Bookmark
- Subscribe
- Mute
- Subscribe to RSS Feed
- Permalink
- Report Inappropriate Content
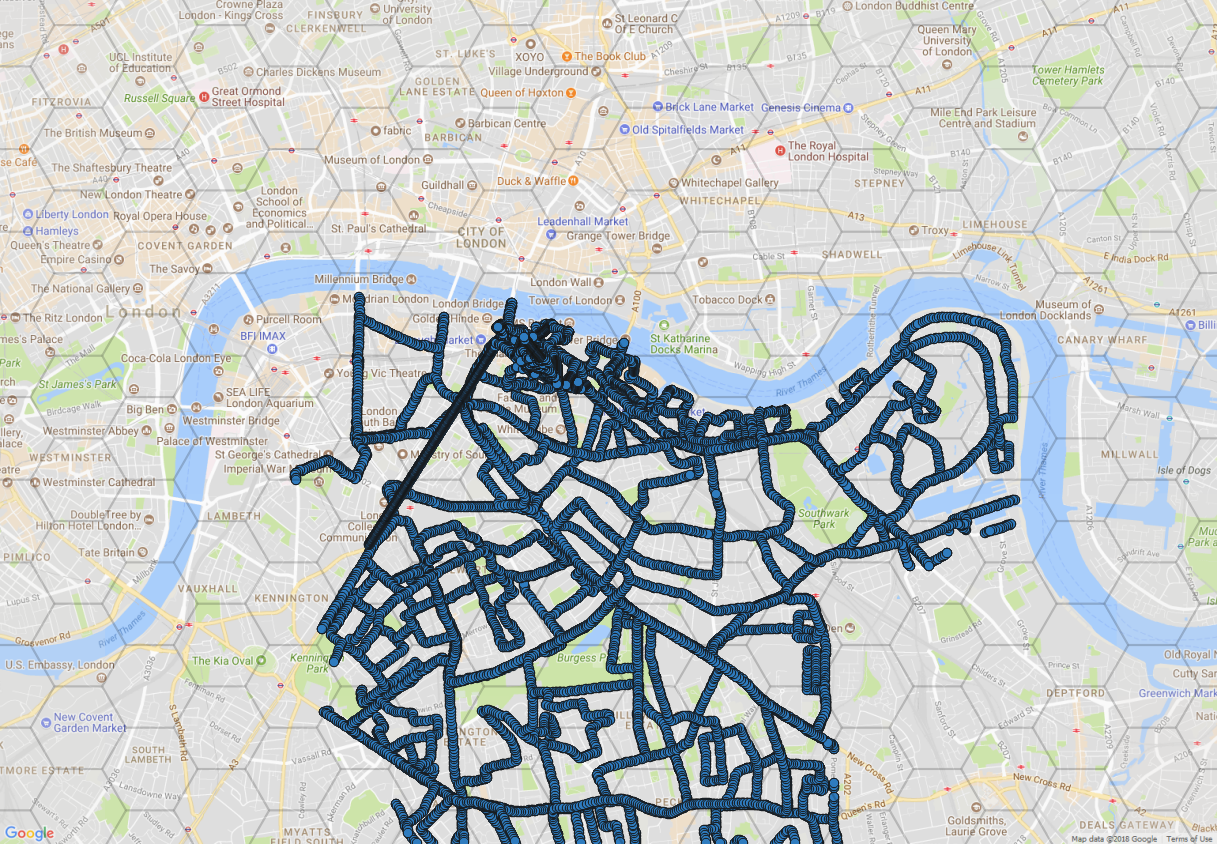
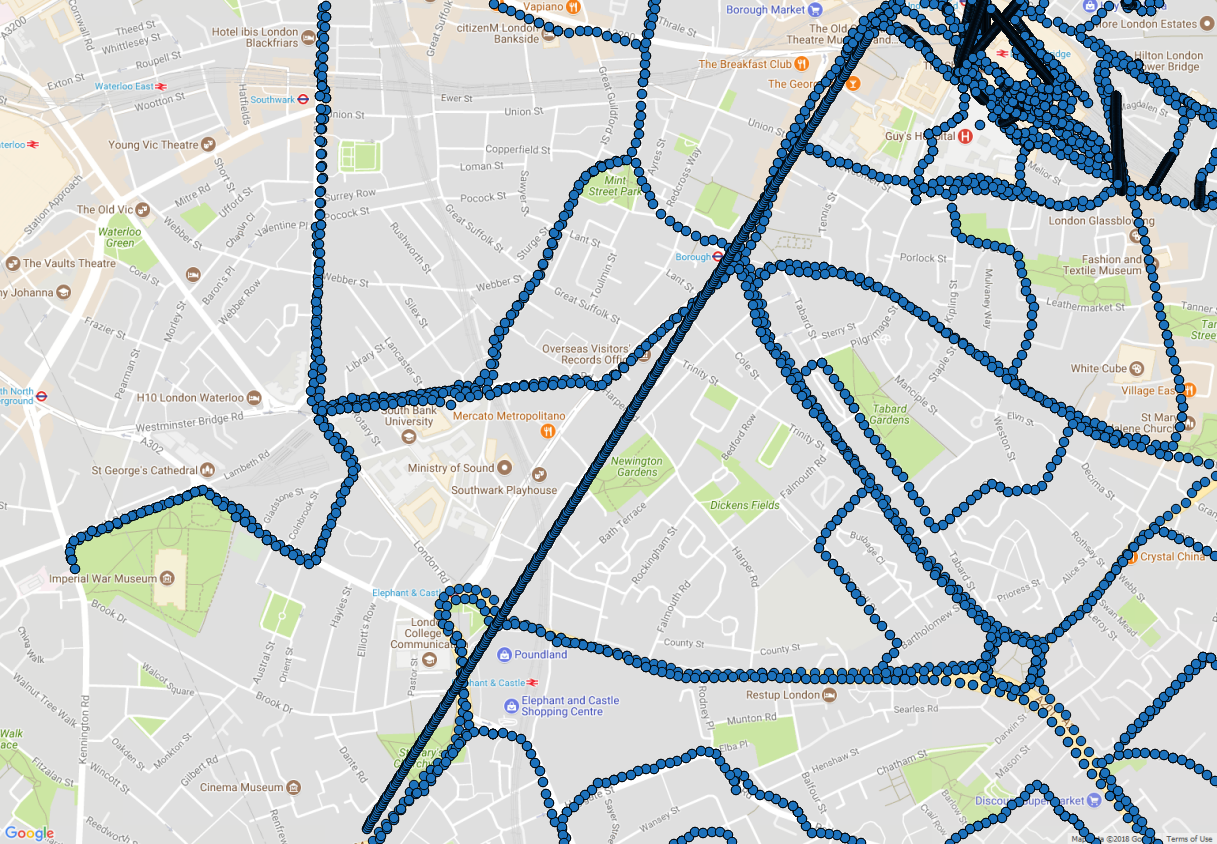
Apologies if this is posted in the wrong place. Please bear with me as i am not trained in this and not sure if i am barking up the wrong tree. So although i am going to ask about ArcGIS i have first attempted this in QGIS which seems to be unable to produce the results i am after so is ArcGIS the right way to go? Ok enough rambling, I hope my explanation is adequate. In QGIS I created a PostGis database and loaded in data creating points (see image Plots) then created a hexagonal grid which is a shapefile (didn't know any other way to achieve this, see image Plots and Grid), then the average is selected from within a specific hexagon so last image 129 plots and an average of -68. So all ok except firstly it takes near enough all day to produce the Hexagonal Grid with the data plots, then if the data plots in the PostGis is updated (plots removed or added to in the database the plots appear and disappear with no problem) the grid does not update as it is a shapefile and therefore needs to be re-created 9another day to re-create it). The end result of this would be a web page where the data is either updated overnight or on the hoof and the plots are displayed within a reasonable time frame and the grid is updated as well.
So not sure if as I said am I trying to do the impossible or can this be achieved in ArcGIS (images round the wrong way first is Plots and Grid, then average count based on single hexagon then data plots from the PostGis table).

- Mark as New
- Bookmark
- Subscribe
- Mute
- Subscribe to RSS Feed
- Permalink
- Report Inappropriate Content
I'm not sure to understand your problem in depth.
Anyway, it sounds like you need this sampling tool inside ArcGIS Pro: Generate Tessellation—Data Management toolbox | ArcGIS Desktop
Cheers
Stefano
- Mark as New
- Bookmark
- Subscribe
- Mute
- Subscribe to RSS Feed
- Permalink
- Report Inappropriate Content
Owen Arnopp it seems like the analysis you are trying to do is around cellular coverage quality verification, is that correct? If I could better understand the end result as it is related to the workflow you are trying to solve, I could suggest some ways of achieving it in ArcGIS.
If this is around drive test analysis or to verify coverage quality, we have numerous ArcGIS users performing this analysis in different ways. Either in real-time or as a batch process overnight. Here is an example: http://www.arcgis.com/apps/StorytellingSwipe/index.html?appid=1af3bebe571644ce9710835f088761a8&webma...
Basic steps to do this are:
- Generate your hexagon grid for the are of coverage. the generate tessellation tool is one option in ArcGIS.
- Perform a Spatial Join between you points and hexagon layer, and run a mean statistics on your RSSI field.
- And your done.
You can set up this process as an automated task to perform each night to update the hexagon layer in web map. We also have user do this in real-time. Here is some information around our coverage mapping solutions: http://arcg.is/0XDi9S
- Mark as New
- Bookmark
- Subscribe
- Mute
- Subscribe to RSS Feed
- Permalink
- Report Inappropriate Content
Here is another resources if you are looking to collect the cell signal information directly in ArcGIS.