- Home
- :
- All Communities
- :
- Products
- :
- ArcGIS Online
- :
- ArcGIS Online Questions
- :
- ArcGIS Online Time Slider Interval
- Subscribe to RSS Feed
- Mark Topic as New
- Mark Topic as Read
- Float this Topic for Current User
- Bookmark
- Subscribe
- Mute
- Printer Friendly Page
ArcGIS Online Time Slider Interval
- Mark as New
- Bookmark
- Subscribe
- Mute
- Subscribe to RSS Feed
- Permalink
- Report Inappropriate Content
Hi,
I have a web map with a couple of time enabled layers with the display set to 1 month increments. I set the start date to the beginning of month, even though the data actually starts on the 30th. This results in the following being displayed: 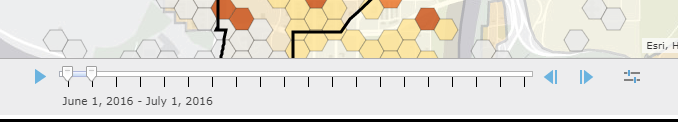
Interesting the month does not end on June 30th.
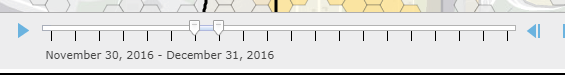
It gets more interesting as you progress through a year.
And when you get to February
.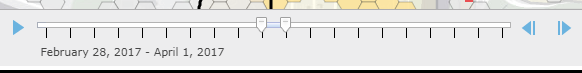
I was hoping the 1 month increment would allow for a actual calendar month not just a straight 31 days.
Any thoughts?
- Mark as New
- Bookmark
- Subscribe
- Mute
- Subscribe to RSS Feed
- Permalink
- Report Inappropriate Content
Having the same issue. I have one set of readings every month to display. My data all exists on the 1st of each month, but when I set the time interval to 1 month at a time it goes from April 1 - May 1, May 1 - June 1 etc. Instead of the end of each interval ending at the last day of the month, it jumps to the first of the next month causing the values for 2 months to display on each interval. Frustrating.
- Mark as New
- Bookmark
- Subscribe
- Mute
- Subscribe to RSS Feed
- Permalink
- Report Inappropriate Content
G'day All!
Same issue here 
I am trying to display yearly financial data and using the default settings I display two years rather than one.
A slight workaround, if I set the increment manually to zero it works.
The configuration options won't let you pick less than one though.
Unsure how the end users will go making this change.
Anyone else made any progress / logged as a bug?
PS As no other questions related to this I'm hoping I have just missed something obvious
Thanks
- Mark as New
- Bookmark
- Subscribe
- Mute
- Subscribe to RSS Feed
- Permalink
- Report Inappropriate Content
G'day Again!
Ok, so found a better fudge, though still a fudge rather than a fix.
I opened the json file in ArcGIS Online Assistant
There is a section for the timeSlider widget.
I added the currentTimeExtent to match my startTime and all now appears to work as I need.
"widgets": {
"timeSlider": {
"properties": {
"startTime": 1372636800000,
"endTime": 1467331260000,
"thumbCount": 2,
"thumbMovingRate": 2000,
"currentTimeExtent": [
1372636800000,
1372636800000
],
"timeStopInterval": {
"interval": 1,
"units": "esriTimeUnitsYears"
}
}
}
},
Enjoy
- Mark as New
- Bookmark
- Subscribe
- Mute
- Subscribe to RSS Feed
- Permalink
- Report Inappropriate Content
Apparently if you build a time slider widget with ArcGIS API for Javascript there is a way to code the time slider to display features for the current point in time: TimeSlider | API Reference | ArcGIS API for JavaScript 3.27
- Mark as New
- Bookmark
- Subscribe
- Mute
- Subscribe to RSS Feed
- Permalink
- Report Inappropriate Content
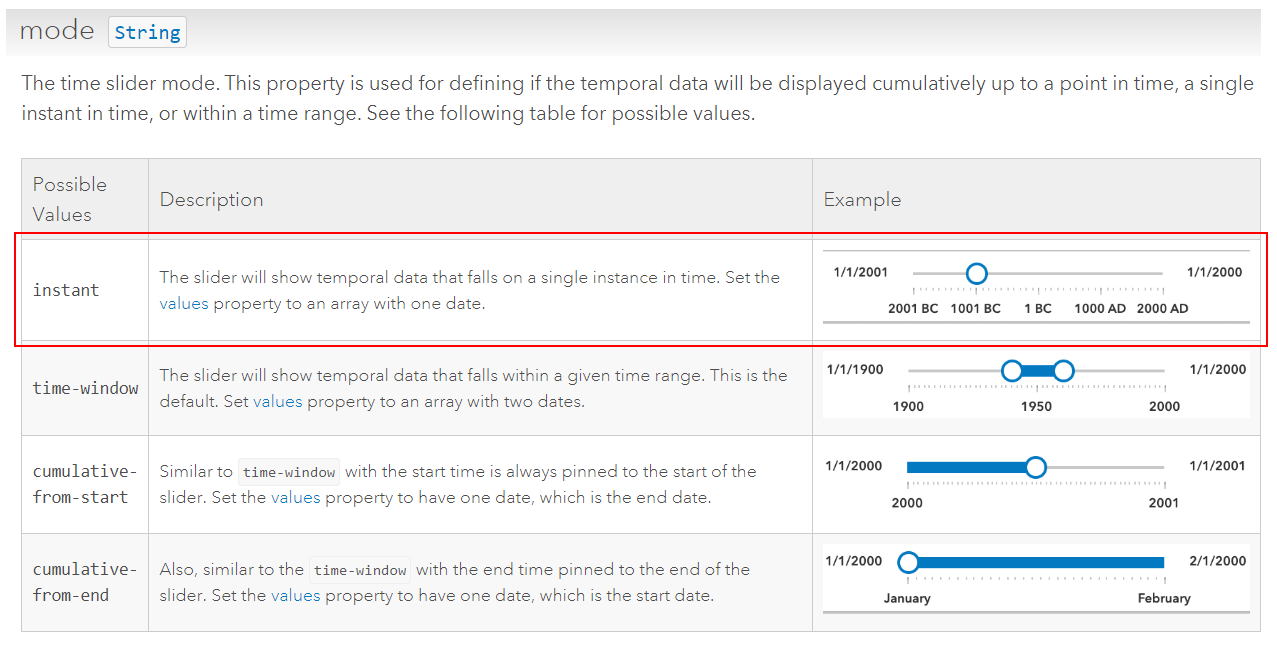
Do you know if it is also possible to edit the json file in order to disable the time extent at all? So you can use the slider only for displaying data that falls on a single instance in time.
For example as described here: TimeSlider | ArcGIS API for JavaScript 4.16
- Mark as New
- Bookmark
- Subscribe
- Mute
- Subscribe to RSS Feed
- Permalink
- Report Inappropriate Content
G'day!
Not something I have done. I haven't played with for a while either.
At a guess, there are only so many variables to play with.
Maybe see if the widget recognises other ersiTimeUnits
Regards