- Home
- :
- All Communities
- :
- Products
- :
- ArcGIS Online
- :
- ArcGIS Online Questions
- :
- Why do my date labels show hours?
- Subscribe to RSS Feed
- Mark Topic as New
- Mark Topic as Read
- Float this Topic for Current User
- Bookmark
- Subscribe
- Mute
- Printer Friendly Page
Why do my date labels show hours?
- Mark as New
- Bookmark
- Subscribe
- Mute
- Subscribe to RSS Feed
- Permalink
- Report Inappropriate Content
In Web App Builder, I have a trend line chart where the x axis is a date field formatted 5/3/2012. There are no hours in these values, but on the x axis, hours are shown.
How do I tell the chart widget to stop doing this?
Thank you,
Randy McGregor
- Mark as New
- Bookmark
- Subscribe
- Mute
- Subscribe to RSS Feed
- Permalink
- Report Inappropriate Content
A date field as formatted will always include the date and time.
Go to your web map
Go to the feature that has the date field.
Select Configure Pop Ups
Choose the Configure Attributes option
Navigate to your date field and select it.
You will see options for the Date field. Uncheck Show Time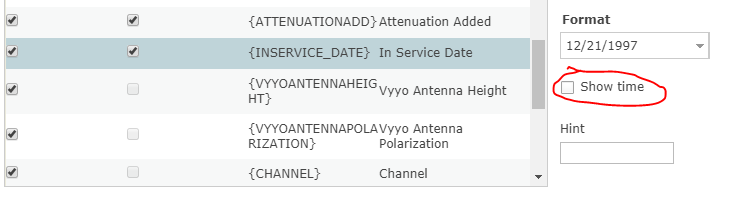
- Mark as New
- Bookmark
- Subscribe
- Mute
- Subscribe to RSS Feed
- Permalink
- Report Inappropriate Content
I appreciate it very much, but the graph tool in web app builder is not respecting this alteration, still showing time. The popup window is showing correctly.
Thanks,
Randy
- Mark as New
- Bookmark
- Subscribe
- Mute
- Subscribe to RSS Feed
- Permalink
- Report Inappropriate Content
 Did you save your web map before setting up the graph in web app builder? I just did it with a feature of mine that has a date field and it worked as expected.
- Mark as New
- Bookmark
- Subscribe
- Mute
- Subscribe to RSS Feed
- Permalink
- Report Inappropriate Content
I appreciate your help, but I appear to have a glitch in my system that I'll need to work out. I see exactly the same thing no matter how much I change the configuration.
12/21/2012 6:00 pm, etc.
Also, when I turn off commas for long numbers that I want to use as dates - i.e., 20171221, it shows commas in the chart.
Either our system has a bug, or I am missing something, but either way you have been helpful and I appreciate your time.
Thanks