- Home
- :
- All Communities
- :
- Products
- :
- Spatial Statistics
- :
- Spatial Statistics Questions
- :
- Hot Spot Analysis Tool / statistically significant...
- Subscribe to RSS Feed
- Mark Topic as New
- Mark Topic as Read
- Float this Topic for Current User
- Bookmark
- Subscribe
- Mute
- Printer Friendly Page
Hot Spot Analysis Tool / statistically significant isolated areas?
- Mark as New
- Bookmark
- Subscribe
- Mute
- Subscribe to RSS Feed
- Permalink
- Report Inappropriate Content
On behalf of my colleague who has technical problems to access this forum I would like to ask:
Using the ArcGIS 10.5 Spatial Statistics Tool Hot Spot Analysis (Getis-Ord Gi*) with a data set for agricultural indicators based on 16,000 europaen community areas (polygons) I got Hot and Cold Spots which shows me a certain geographical pattern. To be a statistically significant hot spot, an area have a high value and is surrounded by other areas with high values as well and vice versa for the Cold Spots. But in some cases I got isolated areas which are statistically significant but they are not surrounded by other statistically significant areas with high or low values. What could be the reason for that?
Christian
- Mark as New
- Bookmark
- Subscribe
- Mute
- Subscribe to RSS Feed
- Permalink
- Report Inappropriate Content
image of what you have would help
- Mark as New
- Bookmark
- Subscribe
- Mute
- Subscribe to RSS Feed
- Permalink
- Report Inappropriate Content
Hi Dan, thanks for asking. I'll try to clarify:
here is a detailed screenshot of a result created with such an outlier: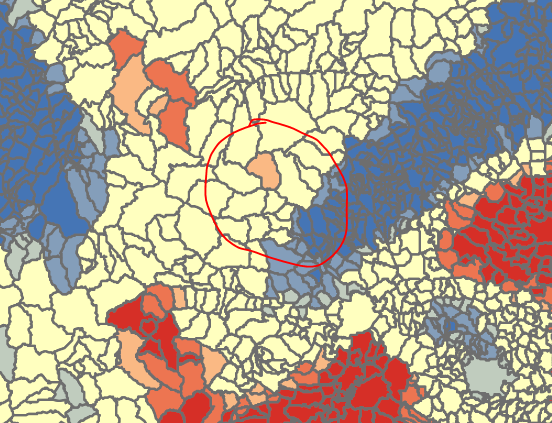
Here's also the complete map: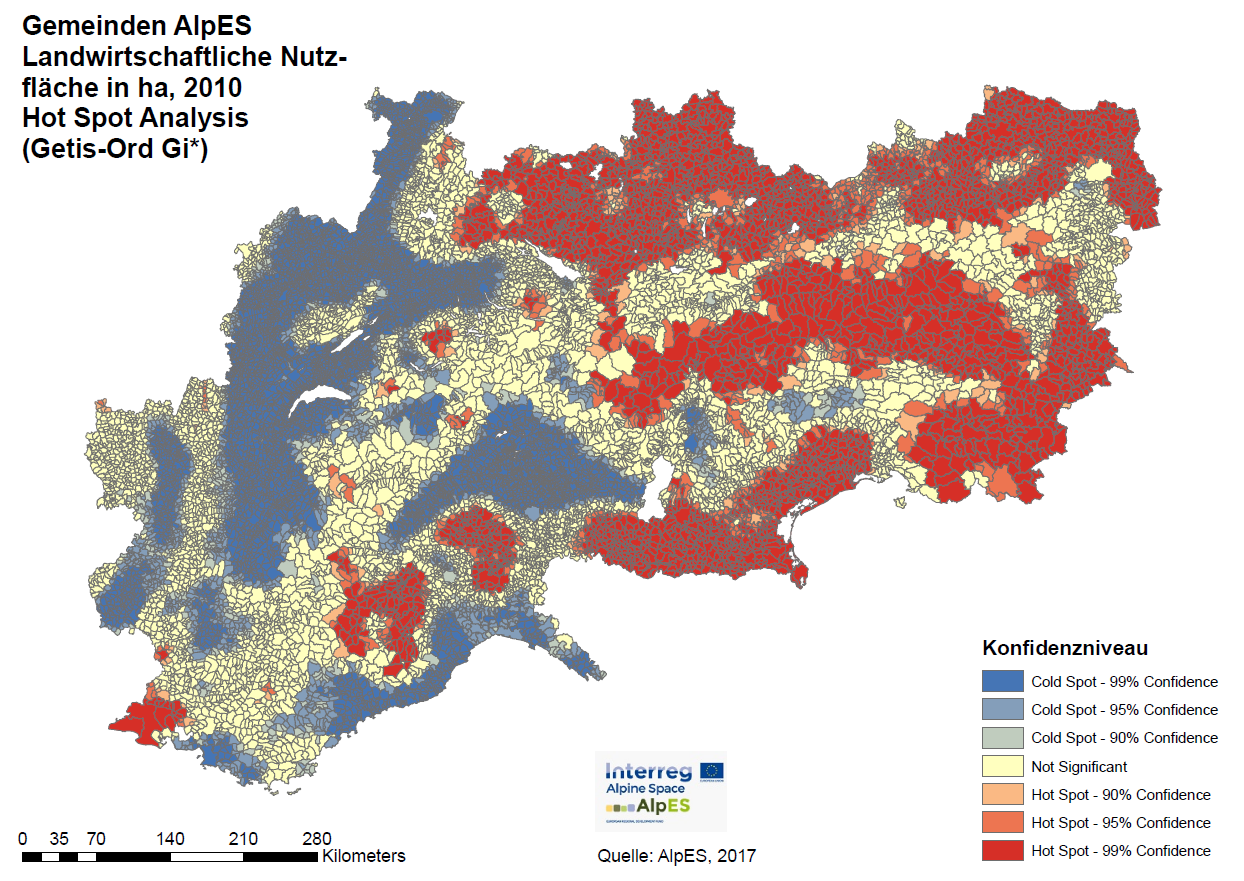
- Mark as New
- Bookmark
- Subscribe
- Mute
- Subscribe to RSS Feed
- Permalink
- Report Inappropriate Content
that is at the 90% confidence level and the surrounding polygons may just have been just below the level to be significant...
you would have to look at your actual data... to me it is reasonable since the map is symbolizing results with 'hard' boundaries when in reality any symbology can lead to such artifact. Consider... are your 99% confidence level really 99%? or they just made it and what about those 95% ones? are they just shy of 99% or 90%???
Never trust what you see, until you can see what to trust
- Mark as New
- Bookmark
- Subscribe
- Mute
- Subscribe to RSS Feed
- Permalink
- Report Inappropriate Content
Hi Dan,
thank you very much for your comment on this issue. It proved to be helpful for my colleague!
Christian
- Mark as New
- Bookmark
- Subscribe
- Mute
- Subscribe to RSS Feed
- Permalink
- Report Inappropriate Content
No problem.