- Home
- :
- All Communities
- :
- Industries
- :
- Natural Resources
- :
- Agriculture
- :
- Agriculture Questions
- :
- How to display numerical data at GPS points on map
- Subscribe to RSS Feed
- Mark Topic as New
- Mark Topic as Read
- Float this Topic for Current User
- Bookmark
- Subscribe
- Mute
- Printer Friendly Page
How to display numerical data at GPS points on map
- Mark as New
- Bookmark
- Subscribe
- Mute
- Subscribe to RSS Feed
- Permalink
- Report Inappropriate Content
Hi All,
I have a (probably very simple) question I was hoping someone could answer. I have 289 GPS points displayed on an orthophoto. For each point in the attribute table, I have a depth (these are points on a lake), temp and other data. I would like to display the depth at each gps point. I can get so far as to display 'circle' symbology and a color ramp at each point. Essentially there are 289 circles of varying color, the lightest color being the shallowest depth, the deepest color being the darkest. However, I simply want to display the numerical depths at each gps point! I have tried clicking around symbology, i have tried hi-lighting the attribute table..I cant seem to simply display the numerical depths at each of the 289 points. Can anyone offer any assistance? It would be greatly appreciated! Thanks!
Solved! Go to Solution.
Accepted Solutions
- Mark as New
- Bookmark
- Subscribe
- Mute
- Subscribe to RSS Feed
- Permalink
- Report Inappropriate Content
Nathan,
I think I understand but still not sure. So instead of colored circles, you want each point to display its numeric property?
To do this, move a couple of tabs over to "Labels" and work from there. The link I mentioned earlier explains some labelling concepts. I hope that makes sense (and I hope I am understanding this properly).
- Mark as New
- Bookmark
- Subscribe
- Mute
- Subscribe to RSS Feed
- Permalink
- Report Inappropriate Content
Hi Nathan,
Which software are you using (Pro? ArcMap? ArcGIS Online?)? Are you trying to show an annotated label for each point? You will need to show labels
Essential labeling concepts—Help | ArcGIS for Desktop
Or are you wanting a certain color for each point?
- Mark as New
- Bookmark
- Subscribe
- Mute
- Subscribe to RSS Feed
- Permalink
- Report Inappropriate Content
Hi Adrian,
Thanks for the quick response!
I am using ArcMap 10.5. I am simply trying to display attribute table data (i.e. depths) at each of the 289 gps points.There are 289 gps points and 289 depths. The GPS points are right over the lake, however I can only get the depths to display as 'representative' colored circles.
I will look at the link you gave me; however, it seems to me that this should just be inherently obvious. I should just be able to right click the layer, go to properties, go to symbology, remove the symbols and select numbers as the desired display. It is recognizing the correct attribute 'value field' and is displaying the values on the table of contents...its just that it is showing the color associated with it .
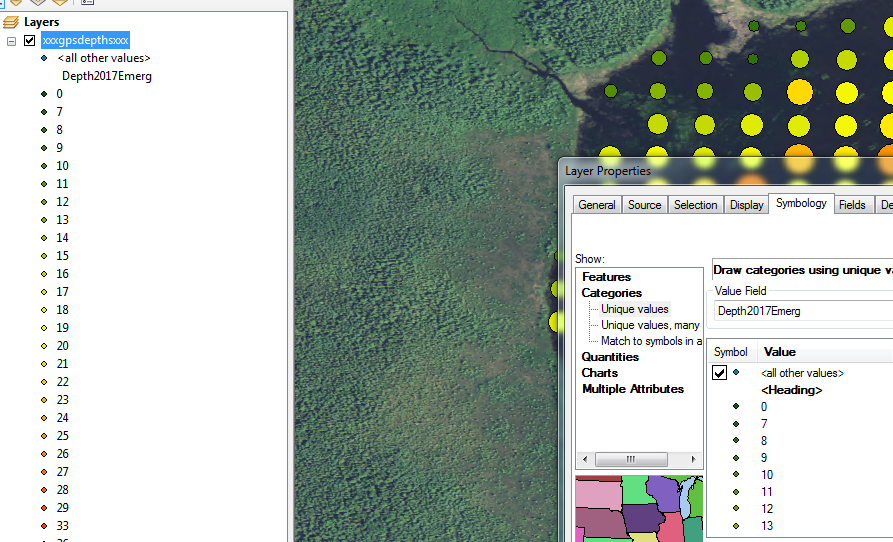 I have attached an image...maybe it will help?
- Mark as New
- Bookmark
- Subscribe
- Mute
- Subscribe to RSS Feed
- Permalink
- Report Inappropriate Content
Nathan,
I think I understand but still not sure. So instead of colored circles, you want each point to display its numeric property?
To do this, move a couple of tabs over to "Labels" and work from there. The link I mentioned earlier explains some labelling concepts. I hope that makes sense (and I hope I am understanding this properly).
- Mark as New
- Bookmark
- Subscribe
- Mute
- Subscribe to RSS Feed
- Permalink
- Report Inappropriate Content
Adrian,
Thank you so much! This was frustratingly simple once I followed your instructions! It is very much appreciated!
- Mark as New
- Bookmark
- Subscribe
- Mute
- Subscribe to RSS Feed
- Permalink
- Report Inappropriate Content
Nathan,
I am glad this was helpful. Please mark the response as "Correct" to close out this thread.
Thanks,
Adrian