- Home
- :
- All Communities
- :
- Products
- :
- ArcGIS Pro
- :
- ArcGIS Pro Questions
- :
- Show Growth of polygon through Time Slider
- Subscribe to RSS Feed
- Mark Topic as New
- Mark Topic as Read
- Float this Topic for Current User
- Bookmark
- Subscribe
- Mute
- Printer Friendly Page
Show Growth of polygon through Time Slider
- Mark as New
- Bookmark
- Subscribe
- Mute
- Subscribe to RSS Feed
- Permalink
- Report Inappropriate Content
Hello. I have a question about the Time Slider/Playback feature in ArcGIS Pro. I am trying to animate the progression of a fire polygon through time with a graduated color ramp. My data is set up with a BeginTime (Date) and an EndTime (Date) to display the acres gained over a 24-hour period.
My goal is to display growth with the "hot" colors spreading out from the first polygon
(a great example of what I am trying to do can be found at http://simtable.com/apps/fireProgression/output2017/IDPAF_000121_Missouri.html ).
Currently, I only have the colors which are set at Day 1 to be fixed spatially. In the below pictures, I have the Day 1 feature start at the cool end of the ramp where it stays and the hot colors waiting to be displayed. It would be ideal to have the hot colors progress spatially through time.
Thank you for any help!
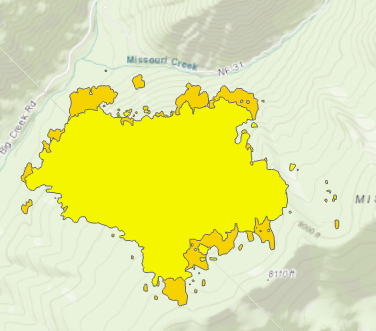 Day 1 & Day 2
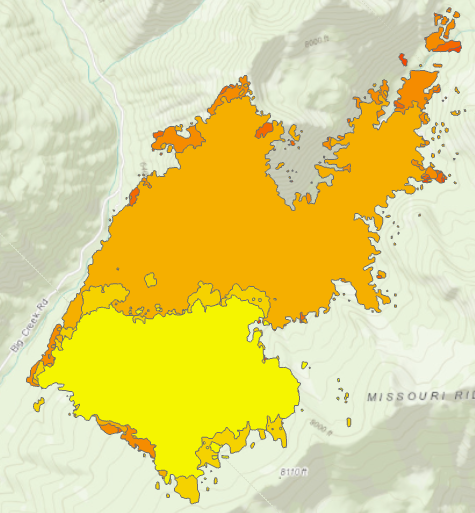 Day 1 - 6
- Mark as New
- Bookmark
- Subscribe
- Mute
- Subscribe to RSS Feed
- Permalink
- Report Inappropriate Content
to cycle through a fixed color ramp, the values to which the symbology is applied would have to be incrementing which would be hard to fudge. I presume the example shown was done manually?
- Mark as New
- Bookmark
- Subscribe
- Mute
- Subscribe to RSS Feed
- Permalink
- Report Inappropriate Content
Manually in that I set the growth areas (dates) to a continuous color ramp and progressed through the time slider function.