- Home
- :
- All Communities
- :
- Products
- :
- ArcGIS Spatial Analyst
- :
- ArcGIS Spatial Analyst Questions
- :
- How to identify the highest and lowest pixels with...
- Subscribe to RSS Feed
- Mark Topic as New
- Mark Topic as Read
- Float this Topic for Current User
- Bookmark
- Subscribe
- Mute
- Printer Friendly Page
How to identify the highest and lowest pixels within a defined neighborhood area of a central pixel
- Mark as New
- Bookmark
- Subscribe
- Mute
- Subscribe to RSS Feed
- Permalink
- Report Inappropriate Content
Hi,
I am using the 'range' statistics type within the 'focal statistics' tool. For each central pixel ArcGIS calculates the difference between the highest and lowest values in the defined neighborhood area and assigns it to the central pixel. What I am now looking for is a way to identify the highest and lowest pixels within that defined neighborhood area.
Any help is much appreciated.
Regards,
Fidel
- Mark as New
- Bookmark
- Subscribe
- Mute
- Subscribe to RSS Feed
- Permalink
- Report Inappropriate Content
focal statistics minimum and focal statistics max plus all the other tools in the focal statistics tools in ArcToolbox will cover all combinations and permutations of gleaning other information
- Mark as New
- Bookmark
- Subscribe
- Mute
- Subscribe to RSS Feed
- Permalink
- Report Inappropriate Content
Hi Dan,
Thanks for the reply.
Yes, but what I am trying to find out is to actually locate the max and min pixels. The focal statistics tools assign the results of the operation to the central pixel and do not give the actual location of the max/min pixels as an output.
Regards,
Fidel
- Mark as New
- Bookmark
- Subscribe
- Mute
- Subscribe to RSS Feed
- Permalink
- Report Inappropriate Content
You can use Focal Flow—Help | ArcGIS Desktop to determine the location of the lowest value. To determine the maximum value, invert your raster (highest value - original raster) and run again.
- Mark as New
- Bookmark
- Subscribe
- Mute
- Subscribe to RSS Feed
- Permalink
- Report Inappropriate Content
so if you are using a focalmin, for example, it will determine the minimum value and assign it to the middle value. Try subtracting the original raster from that raster and values of 0 should identify the cell location where the minimum occurred.
- Mark as New
- Bookmark
- Subscribe
- Mute
- Subscribe to RSS Feed
- Permalink
- Report Inappropriate Content
If the OP needs to identify the lowest and highest position in a 3x3 window for each pixel I think it will need the Focal Flow to obtain that. Each pixel will obtain a value to points to the relative position where the highest or lowest pixel is located.
- Mark as New
- Bookmark
- Subscribe
- Mute
- Subscribe to RSS Feed
- Permalink
- Report Inappropriate Content
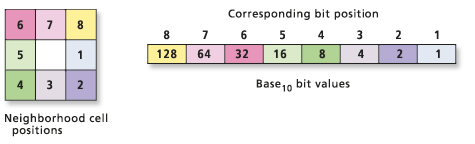
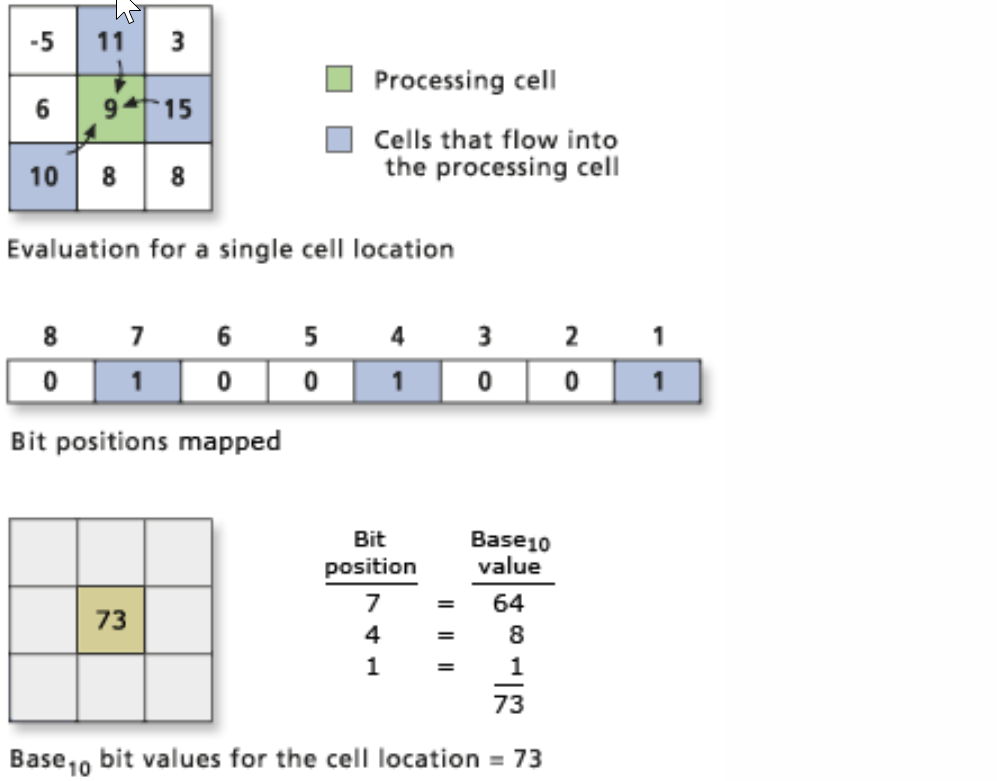
From the link on focal flow or even flow direction, they do use the surrounding cells in their calculation. In the case of focal flow, the cells that contribute the core cell. they don't tell you the exact location of the cells represent the minimum. In the example below, we should get a value of -5 for the minimum, 15 for the maximum and 20 for the range assigned to the core cell. If we use the focal minimum raster and subtracted the input raster from it, we should get a 0 for the top left cell. Values of 0 would be the minimum of one of the moving windows, assuming raster processing is from top left, then the value of 0 would correspond to core cells in standard row/column format.
From Focal Flow
Now having said that, if the raster were exported to a numpy array, there are other ways of doing this even using rolling statistics or queries.
a
array([[-5, 11, 3],
[ 6, 9, 15],
[10, 8, 8]])
m = np.min(a, (0,1)) # along the row, column... returns -5
np.argwhere(a == m)
array([[0, 0]], dtype=int64) # row 0, column 0- Mark as New
- Bookmark
- Subscribe
- Mute
- Subscribe to RSS Feed
- Permalink
- Report Inappropriate Content
Here is how to locate each cell that is the highest or lowest value in its own 3x3 neighborhood. Not sure this is exactly what you want, but I thought I'd throw it out there.
The expressions below are formatted for the Raster Calculator tool. BTW, I used "" for neighborhood to use the default, NbrRectangle(3,3).
# Cells that are the lowest of the 3x3 around that cell
Con(FocalStatistics("in_grid", "", "MINIMUM") == "in_grid"), "in_grid")
# Cells that are the highest of the 3x3 around that cell
Con(FocalStatistics("in_grid", "", "MAXIMUM") == "in_grid", "in_grid")- Mark as New
- Bookmark
- Subscribe
- Mute
- Subscribe to RSS Feed
- Permalink
- Report Inappropriate Content
Dan_Patterson, xander_bakker, curtvprice
Thank you all for the help so far.
The suggested methods are unfortunately not doing what I want to do. This is mainly because the neighborhood zone is overlapping as the operation moves from one cell to another cell. The minimum cell for the first central cell will change its value to the minimum value for its own neighborhood as the operation moves from cell to cell. As a result subtracting the minimum raster from the original raster (or the method suggested by Curtis) will not give me the locations of all the minimum cells for each neighborhood zone.
Any more suggestions are appreciated.
Cheers
Fidel
- Mark as New
- Bookmark
- Subscribe
- Mute
- Subscribe to RSS Feed
- Permalink
- Report Inappropriate Content
Have you tried the Flow Direction tool yet? It will return the lowest value for each pixel in a 3x3 neighborhood.