- Home
- :
- All Communities
- :
- Products
- :
- Imagery and Remote Sensing
- :
- Imagery Questions
- :
- Classify with mosaic dataset
- Subscribe to RSS Feed
- Mark Topic as New
- Mark Topic as Read
- Float this Topic for Current User
- Bookmark
- Subscribe
- Mute
- Printer Friendly Page
Classify with mosaic dataset
- Mark as New
- Bookmark
- Subscribe
- Mute
- Subscribe to RSS Feed
- Permalink
- Report Inappropriate Content
We have a mosaic dataset with elevation data. I need to show in two classes.
1) Elevations at risk of flooding
2) Elevations not at risk
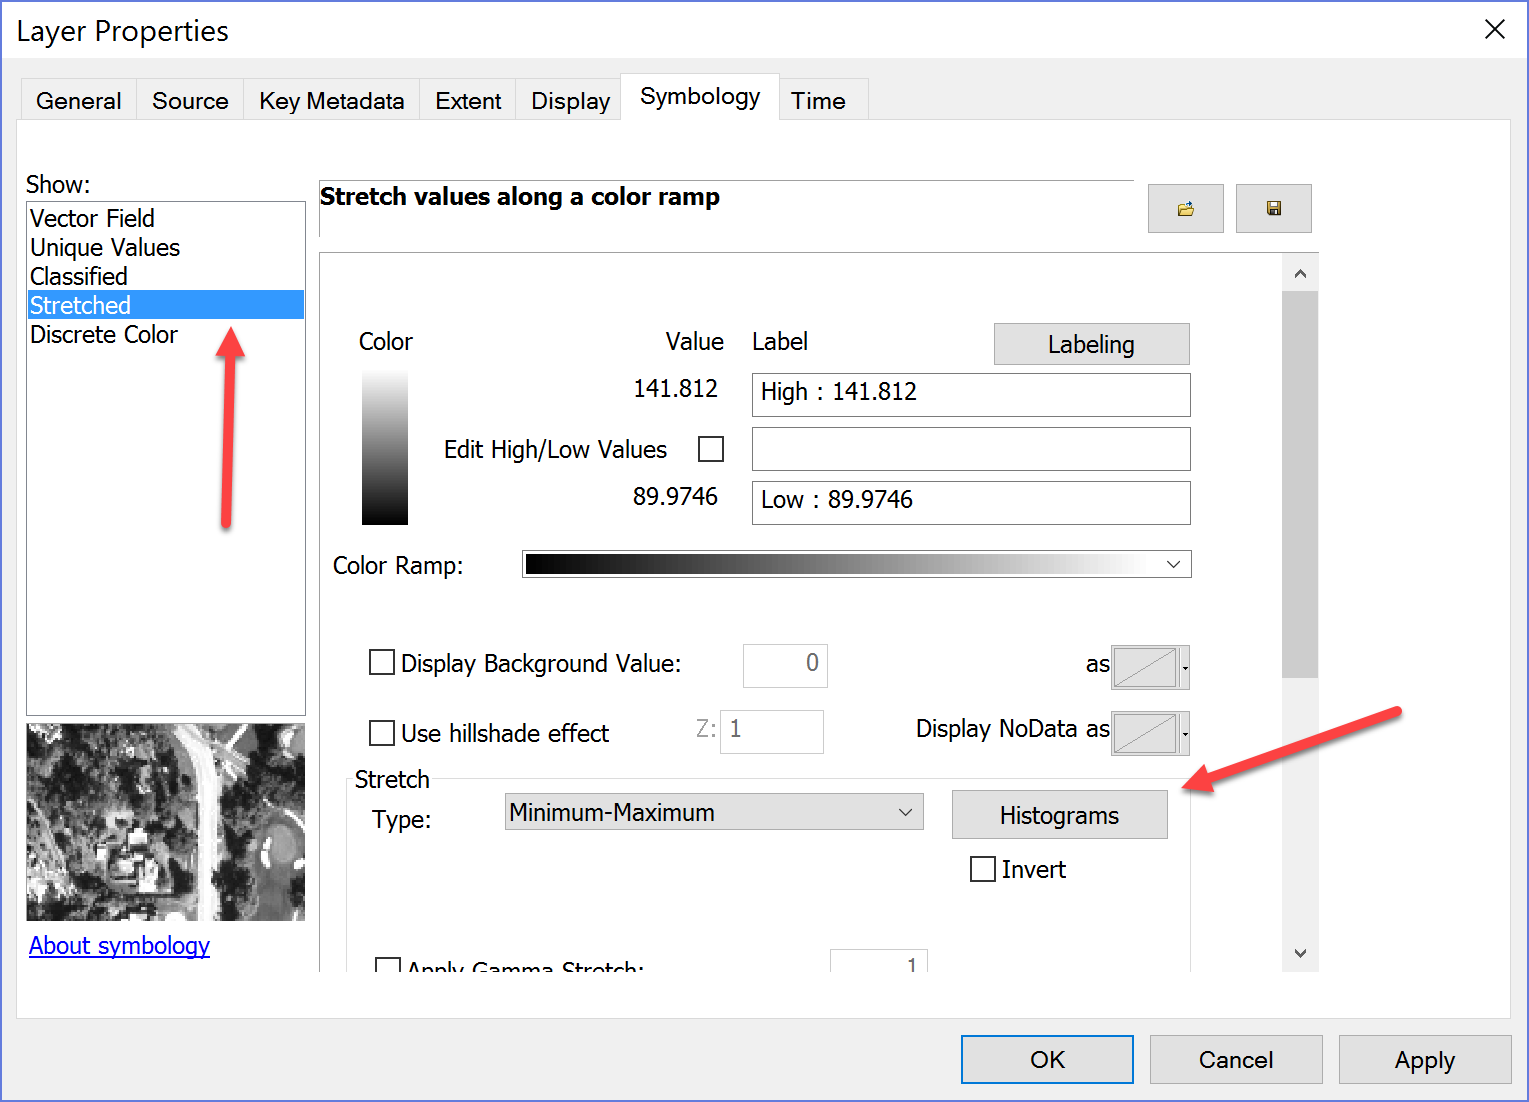
There are statistics calculated for the mosaic. But when I look at the symbology properties there is no option for classify?

- Mark as New
- Bookmark
- Subscribe
- Mute
- Subscribe to RSS Feed
- Permalink
- Report Inappropriate Content
how were statistics calculated? since some methods aren't permanent and if they are present you should have more options... did you use this method?
To calculate statistics on the mosaic dataset, right-click the mosaic dataset in the Catalog window and click Calculate Statistics; the Calculate Statistics tool opens. You can also open this tool directly.
- Mark as New
- Bookmark
- Subscribe
- Mute
- Subscribe to RSS Feed
- Permalink
- Report Inappropriate Content
As I understand it they were done with the tool (I don't want to redo it). If one looks in the properties one can see the statistics.
- Mark as New
- Bookmark
- Subscribe
- Mute
- Subscribe to RSS Feed
- Permalink
- Report Inappropriate Content
all I see is the max and min... not quite the same, but it must be something totally else if you don't want to recalculate them
- Mark as New
- Bookmark
- Subscribe
- Mute
- Subscribe to RSS Feed
- Permalink
- Report Inappropriate Content
well it is a massive data set. I want to eliminate everything else before I go for that.
- Mark as New
- Bookmark
- Subscribe
- Mute
- Subscribe to RSS Feed
- Permalink
- Report Inappropriate Content
from the link I sent... so check your stretch options first to see if they are there
If statistics do not exist for a mosaic dataset, they are not calculated automatically when displayed in ArcMap. If statistics exist for a mosaic dataset, more stretch methods are available (such as Percent Clip and Histogram Equalization).
- Mark as New
- Bookmark
- Subscribe
- Mute
- Subscribe to RSS Feed
- Permalink
- Report Inappropriate Content
yes they are there
- Mark as New
- Bookmark
- Subscribe
- Mute
- Subscribe to RSS Feed
- Permalink
- Report Inappropriate Content
hmmm no histogram like mine then... maybe give a recalculate a go