- Home
- :
- All Communities
- :
- Products
- :
- Geoprocessing
- :
- Geoprocessing Questions
- :
- Area solar radiation tool global output seems wron...
- Subscribe to RSS Feed
- Mark Topic as New
- Mark Topic as Read
- Float this Topic for Current User
- Bookmark
- Subscribe
- Mute
- Printer Friendly Page
Area solar radiation tool global output seems wrong?
- Mark as New
- Bookmark
- Subscribe
- Mute
- Subscribe to RSS Feed
- Permalink
- Report Inappropriate Content
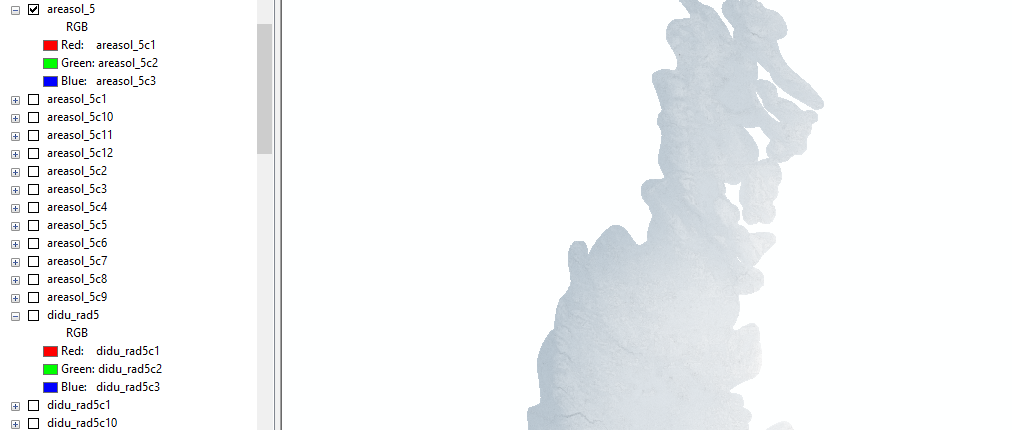
I've ran a few Area Solar Radiation tool models for an entire year with one month intervals. For all three runs I found that the global outputs (the total for the entire year for direct, diffuse, and duration) are composite rasters containing the first three months of the year. This seems to be entirely wrong results. In my opinion the total annual output for a cell should equal all 12 months combined for that particular cell. And definitely not a red, green, blue composite of the first 3 months. Any ideas as to what the issue is? Is it correct for me to just use the Raster Calculator to add all the month outputs together to get the correct annual outputs? The screen clip below shows the annual output raster legends for direct and diffuse radiation. Notice it's a composite and not a single band raster of values.
Solved! Go to Solution.
Accepted Solutions
- Mark as New
- Bookmark
- Subscribe
- Mute
- Subscribe to RSS Feed
- Permalink
- Report Inappropriate Content
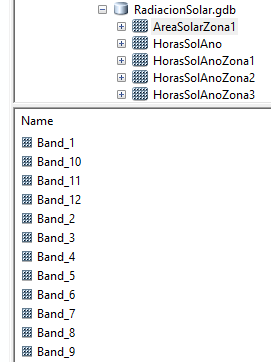
I am sure that your calculation went fine. What you have to understand is that you calculated the solar radiation with an output for each interval. The tool will create a band for each interval (month). If you navigate to you workspace and expand the content of the output raster you will see that there are 12 bands:
ArcGIS will try to visualize a multiband raster using 3 bands assigning them to red, blue and green intensities. Your conclusion that you are seeing a result based on the first 3 months of the year is correct. You can add the rasters for each month separately to the TOC and work on them separately and if required, using the raster calculator to create an mean or sum raster from the 12 bands.
- Mark as New
- Bookmark
- Subscribe
- Mute
- Subscribe to RSS Feed
- Permalink
- Report Inappropriate Content
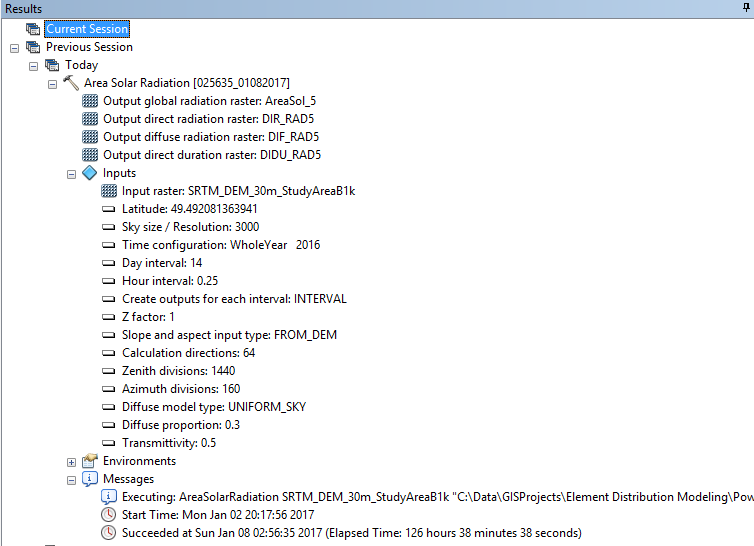
What options did you specify? The details of the increments etc are quite detailed and perhaps the defaults aren't what you expect. For example you can specify ouput options for ... out_direct_radiation_raster and out_diffuse_radiation_raster which return raster datasets
- Mark as New
- Bookmark
- Subscribe
- Mute
- Subscribe to RSS Feed
- Permalink
- Report Inappropriate Content
Hello
I specified a year with monthly outputs for direct, diffuse, and duration. The tool isn't so clear but I also receive monthly direct+diffuse radiation surfaces as well. The monthly outputs appear to be correct in that they are at least not composite rasters. The tool does ask for a file name input for the global radiation (direct + diffuse) raster but I also receive global rasters for direct, diffuse, and duration.
All four of these annual outputs appear to be composite rasters of the first 3 months of the year not just single rasters showing annual totals. This has occurred for the last 3 tool runs for this model. Perhaps it's just a bug with the tool or something happens during the fairly long time it takes the tool to run, or maybe even my fault. I don't understand though how any tool input changes would lead to this type of bizarre outputs.
In any case I believe I should be able to get total annual rasters for direct, diffuse, and duration by adding all 12 months of each variable using the raster calculator. Makes sense to me to proceed this way. Just odd that this happened and makes me feel less trusting of the other monthly outputs.
I've added a screen shot of my inputs:
- Mark as New
- Bookmark
- Subscribe
- Mute
- Subscribe to RSS Feed
- Permalink
- Report Inappropriate Content
I am sure that your calculation went fine. What you have to understand is that you calculated the solar radiation with an output for each interval. The tool will create a band for each interval (month). If you navigate to you workspace and expand the content of the output raster you will see that there are 12 bands:
ArcGIS will try to visualize a multiband raster using 3 bands assigning them to red, blue and green intensities. Your conclusion that you are seeing a result based on the first 3 months of the year is correct. You can add the rasters for each month separately to the TOC and work on them separately and if required, using the raster calculator to create an mean or sum raster from the 12 bands.
- Mark as New
- Bookmark
- Subscribe
- Mute
- Subscribe to RSS Feed
- Permalink
- Report Inappropriate Content
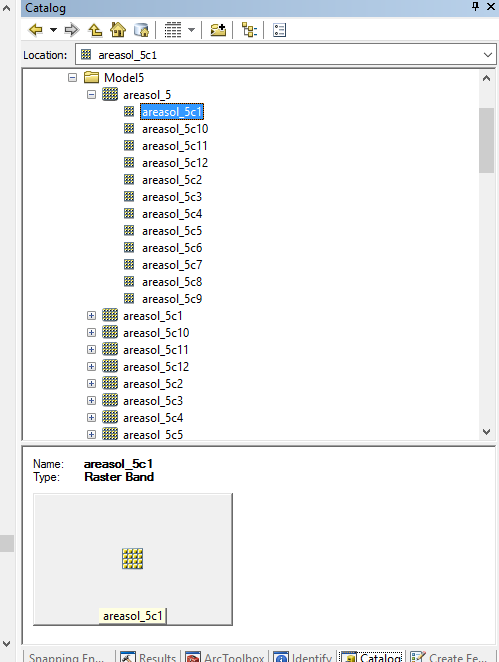
Ah! In ArcCatalog I see what you are describing. I was thinking incorrectly. I was thinking that the global totals would only be one band with values being the sum of all the intervals. In the output I also received individual bands for month intervals separate from the global rasters (see screen clip) I guess because I asked for it in my options. Any idea why or any advantage for the tool to structure the output this way? In my mind it would make sense to have one raster of global totals for the time period and separate rasters for each interval. I mean most users would probably want a total for the entire time period. Thank you!
- Mark as New
- Bookmark
- Subscribe
- Mute
- Subscribe to RSS Feed
- Permalink
- Report Inappropriate Content
You are not the first (and surely the last) to struggle with understanding this output format. It happened to me too. And yes, it would be great to have a summed raster as an additional output. However, the help does state that multiple bands are created:
The Create outputs for each interval parameter affects the format and number of output radiation files. When checked, the output raster will contain multiple bands that correspond to the radiation or duration values for each time interval (hour interval when time configuration is less than one day, or day interval when multiple days).
- Mark as New
- Bookmark
- Subscribe
- Mute
- Subscribe to RSS Feed
- Permalink
- Report Inappropriate Content
So it does... I'm sure I read the help at least 5 times. Thank you again.