- Home
- :
- All Communities
- :
- Products
- :
- ArcGIS Spatial Analyst
- :
- ArcGIS Spatial Analyst Questions
- :
- How to get value from a Raster?
- Subscribe to RSS Feed
- Mark Topic as New
- Mark Topic as Read
- Float this Topic for Current User
- Bookmark
- Subscribe
- Mute
- Printer Friendly Page
- Mark as New
- Bookmark
- Subscribe
- Mute
- Subscribe to RSS Feed
- Permalink
- Report Inappropriate Content
I have a Raster precipitation, lets say for Washington state and I have vector study area of that state. I want to get the precipitation in mm/year and the information is in my raster( precipitation) I tried to clip my raster to my study area and now the next step is to get precipitation in mm/year in min , max or average. Can anyone help me how get that ? one way is to right click on Raster for property and there I can see the max , min and average but I am not about this.
Solved! Go to Solution.
Accepted Solutions
- Mark as New
- Bookmark
- Subscribe
- Mute
- Subscribe to RSS Feed
- Permalink
- Report Inappropriate Content
That can be constructed for an assignment perhaps to avoid the extra step of accounting for the z-factor needed to translate to feet. The point I made is that the discussion on the plausibility of the values is moot.
- Mark as New
- Bookmark
- Subscribe
- Mute
- Subscribe to RSS Feed
- Permalink
- Report Inappropriate Content
In the Spatial Analyst tool box under Zonal there are the Zonal Statistics and Zonal Statistics as Table. This summarise various stats (mean, min, max whatever) per zone defined as polygons or another raster.
There is also the GetRasterProperties_management tool in the data management toolbox.
- Mark as New
- Bookmark
- Subscribe
- Mute
- Subscribe to RSS Feed
- Permalink
- Report Inappropriate Content
- Mark as New
- Bookmark
- Subscribe
- Mute
- Subscribe to RSS Feed
- Permalink
- Report Inappropriate Content
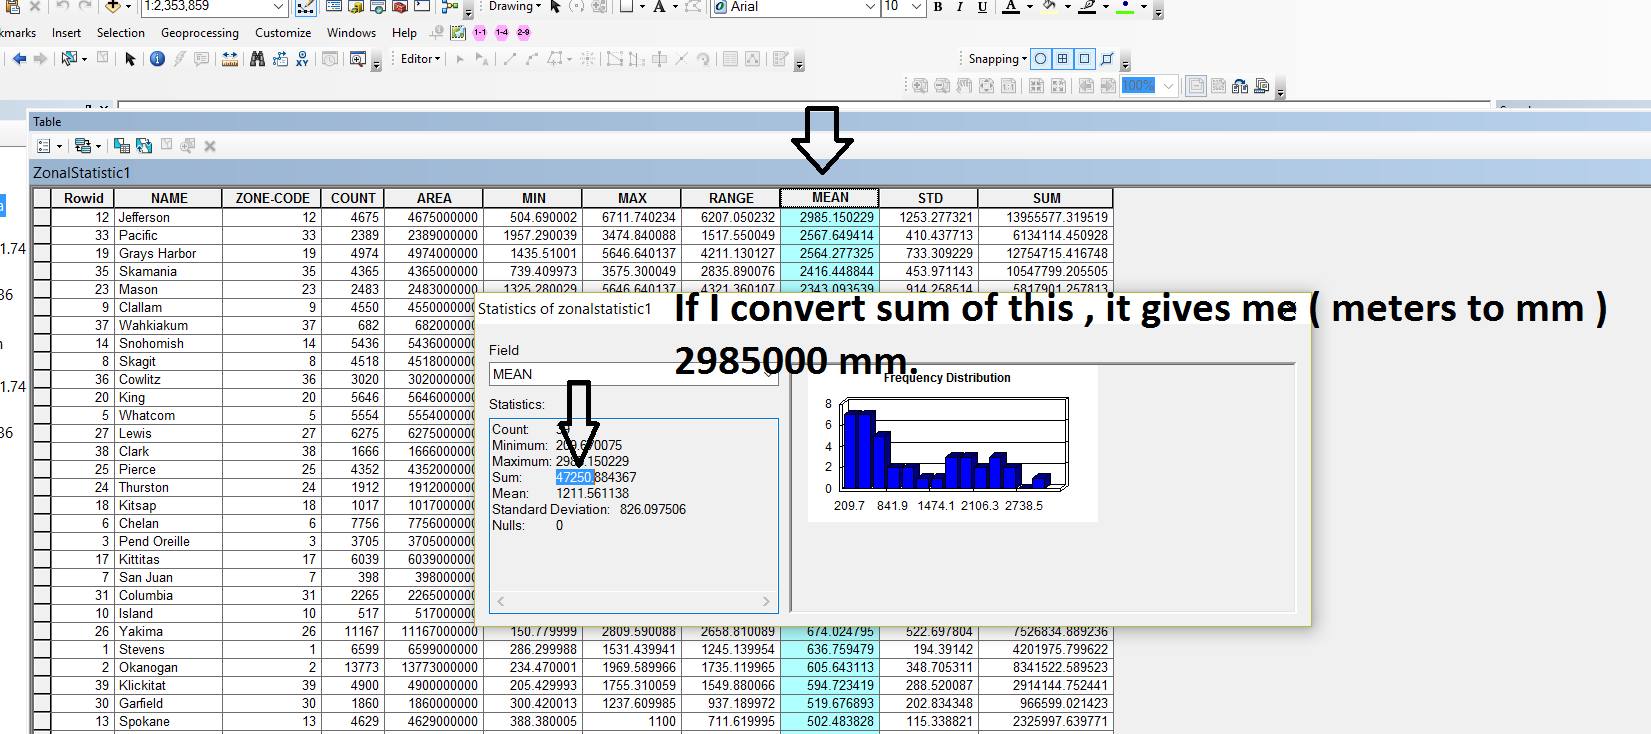
the result which I am after for this problem is mm/year. so as you can see the picture, I took the average and you can also see the statistic sum of that. I converted from meter( because my raster is in meter) to mm and it gives me very big data 2985000 mm which I am not sure if it can give me correct result.
- Mark as New
- Bookmark
- Subscribe
- Mute
- Subscribe to RSS Feed
- Permalink
- Report Inappropriate Content
Are you sure the precipitation values in the Raster are in meters? Because a 7-digit number in mm/year seems to be too high to be true. I think the values are already in mm/year.
Don't confuse with the spatial resolution of the Raster (which could be in meters).
***Why I think so? The wettest place in India has an avg. annual rainfall of <12000 mm.
Think Location
- Mark as New
- Bookmark
- Subscribe
- Mute
- Subscribe to RSS Feed
- Permalink
- Report Inappropriate Content
I checked the property of my raster and it says meters and that is why I am assuming that its in meters. you are right the number is too high!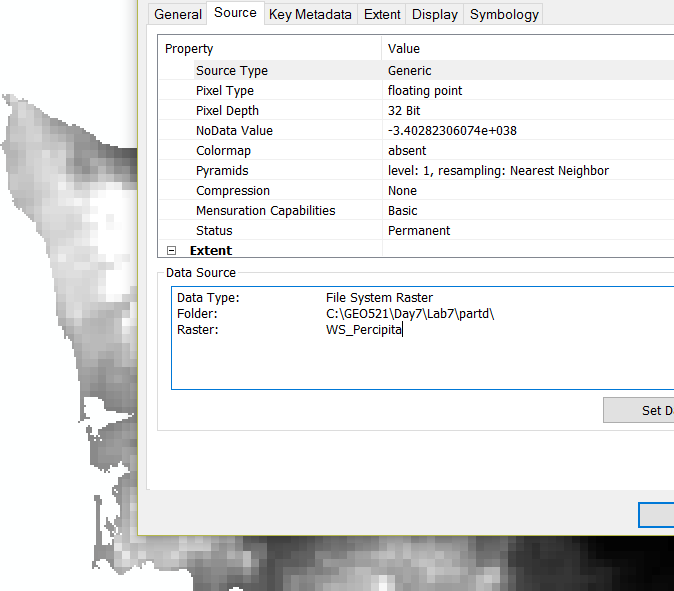
- Mark as New
- Bookmark
- Subscribe
- Mute
- Subscribe to RSS Feed
- Permalink
- Report Inappropriate Content
This is the spatial resolution (the dimensions of a pixel) of the Raster, not the unit of precipitation. You can consider the value of precipitation is in mm.
Think Location
- Mark as New
- Bookmark
- Subscribe
- Mute
- Subscribe to RSS Feed
- Permalink
- Report Inappropriate Content

- Mark as New
- Bookmark
- Subscribe
- Mute
- Subscribe to RSS Feed
- Permalink
- Report Inappropriate Content
To get this I have not used any tool I just clip the raster to my study area and click and check its property to see the min , max and average. I am assuming this is not correct because when I compare with my original data ( raster) they are same.
- Mark as New
- Bookmark
- Subscribe
- Mute
- Subscribe to RSS Feed
- Permalink
- Report Inappropriate Content
Do you want to calculate the statistics based on the boundary polygon? Then, you could choose Zonal Satistics with the appropriate Statistics Type. How Zonal Statistics works—Help | ArcGIS for Desktop
Think Location