Turn on suggestions
Auto-suggest helps you quickly narrow down your search results by suggesting possible matches as you type.
Cancel
- Home
- :
- All Communities
- :
- Products
- :
- 3D
- :
- 3D Questions
- :
- Inverting elevation profile graph
Options
- Subscribe to RSS Feed
- Mark Topic as New
- Mark Topic as Read
- Float this Topic for Current User
- Bookmark
- Subscribe
- Mute
- Printer Friendly Page
10-05-2016
08:50 AM
- Mark as New
- Bookmark
- Subscribe
- Mute
- Subscribe to RSS Feed
- Permalink
- Report Inappropriate Content
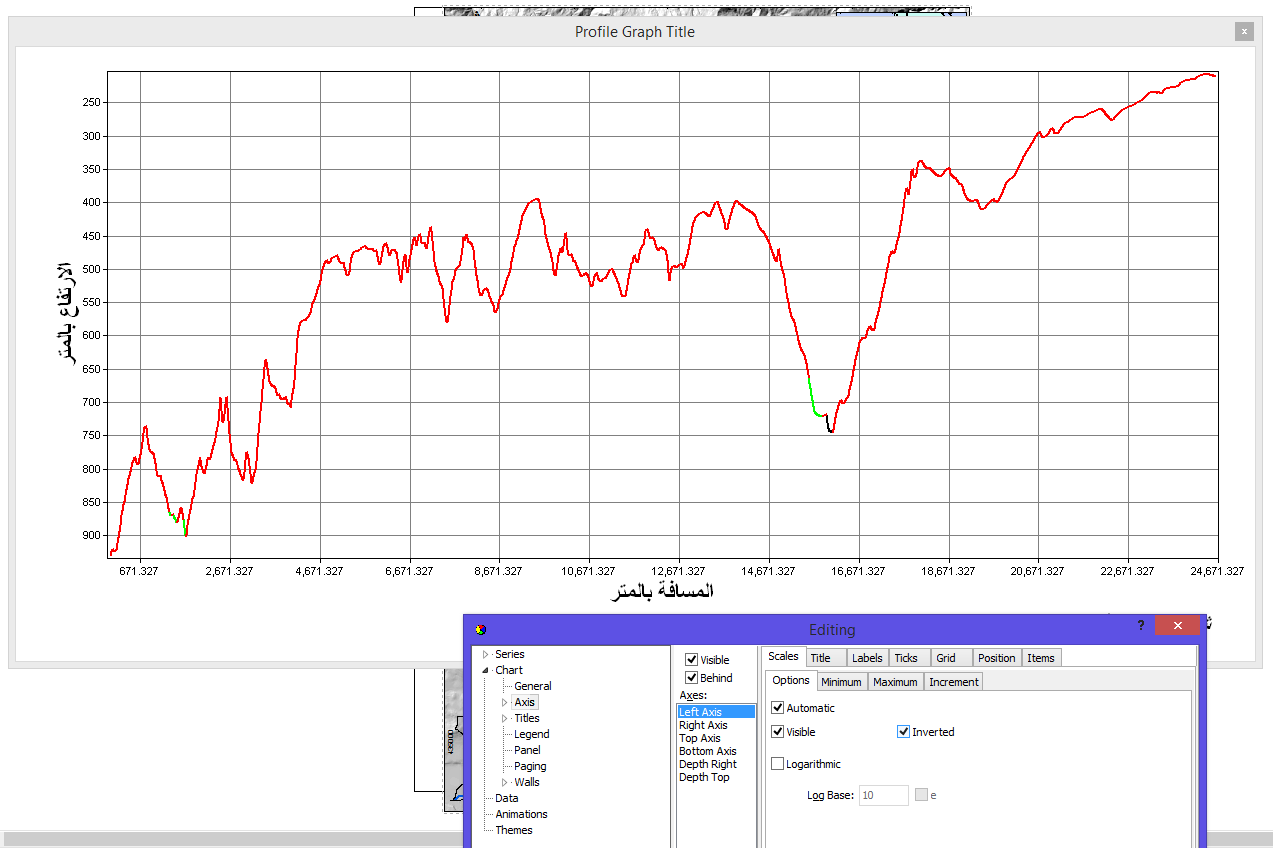
I interpolated a line and I want to display the elevation profile in a graph. In the graph, it is starting from the highest point to the lowest, but I want it to be displayed from the lowest to the highest. How?
Solved! Go to Solution.
1 Solution
Accepted Solutions
10-05-2016
02:13 PM
- Mark as New
- Bookmark
- Subscribe
- Mute
- Subscribe to RSS Feed
- Permalink
- Report Inappropriate Content
I used the tool Flip line for the line I wanted. The graph is drawn in the same order the line was digitized. Flip line invert this.
3 Replies
10-05-2016
10:55 AM
- Mark as New
- Bookmark
- Subscribe
- Mute
- Subscribe to RSS Feed
- Permalink
- Report Inappropriate Content
picture? negate the X axis?
10-05-2016
02:13 PM
- Mark as New
- Bookmark
- Subscribe
- Mute
- Subscribe to RSS Feed
- Permalink
- Report Inappropriate Content
I used the tool Flip line for the line I wanted. The graph is drawn in the same order the line was digitized. Flip line invert this.
05-02-2018
07:45 AM
- Mark as New
- Bookmark
- Subscribe
- Mute
- Subscribe to RSS Feed
- Permalink
- Report Inappropriate Content
Right click on the graph ---> Advanced properties---> Axis, and check inverted (see the picture)