- Home
- :
- All Communities
- :
- Developers
- :
- JavaScript Maps SDK
- :
- JavaScript Maps SDK Questions
- :
- How to set offset for a line symbol?
- Subscribe to RSS Feed
- Mark Topic as New
- Mark Topic as Read
- Float this Topic for Current User
- Bookmark
- Subscribe
- Mute
- Printer Friendly Page
How to set offset for a line symbol?
- Mark as New
- Bookmark
- Subscribe
- Mute
- Subscribe to RSS Feed
- Permalink
- Report Inappropriate Content
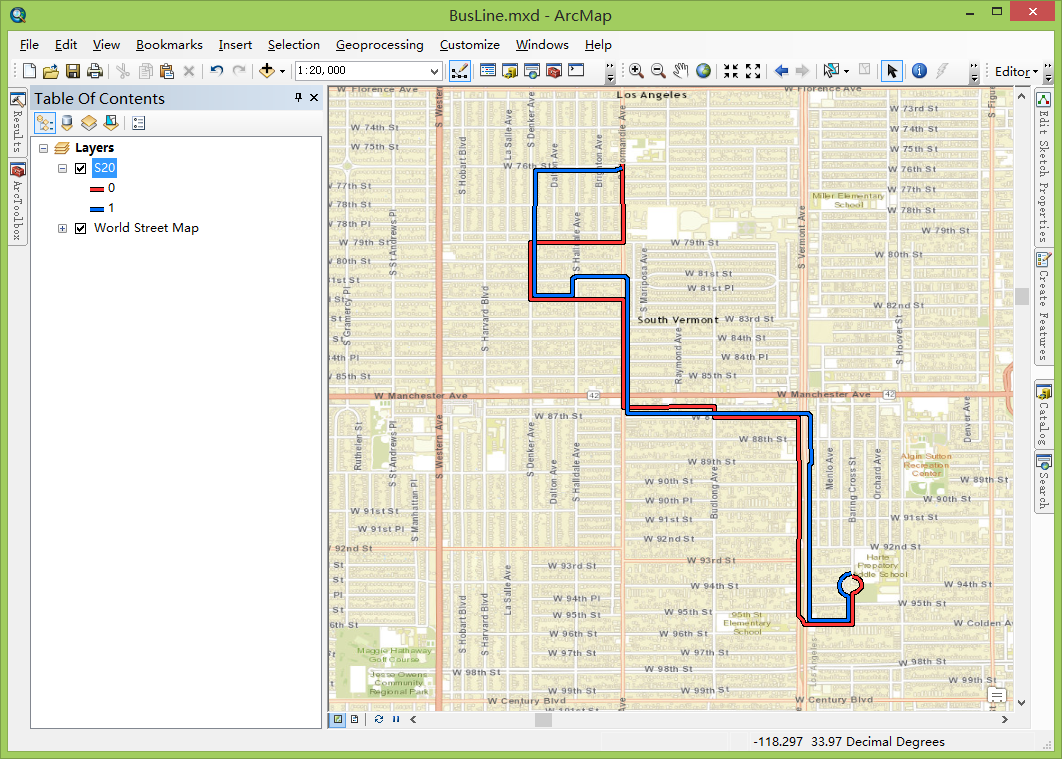
Hi, I have a routing layer with lots of bus route. In order to distinguish the collinear route, I used offset property in arcmap line properties. But how to show the same effect on a web map? Since the route is dynamic solved by route task, it may be not suit to publish a map services. Is there a way to set the symbol of a graphic?
The mapping result in arcmap:
The webmap I've tried:
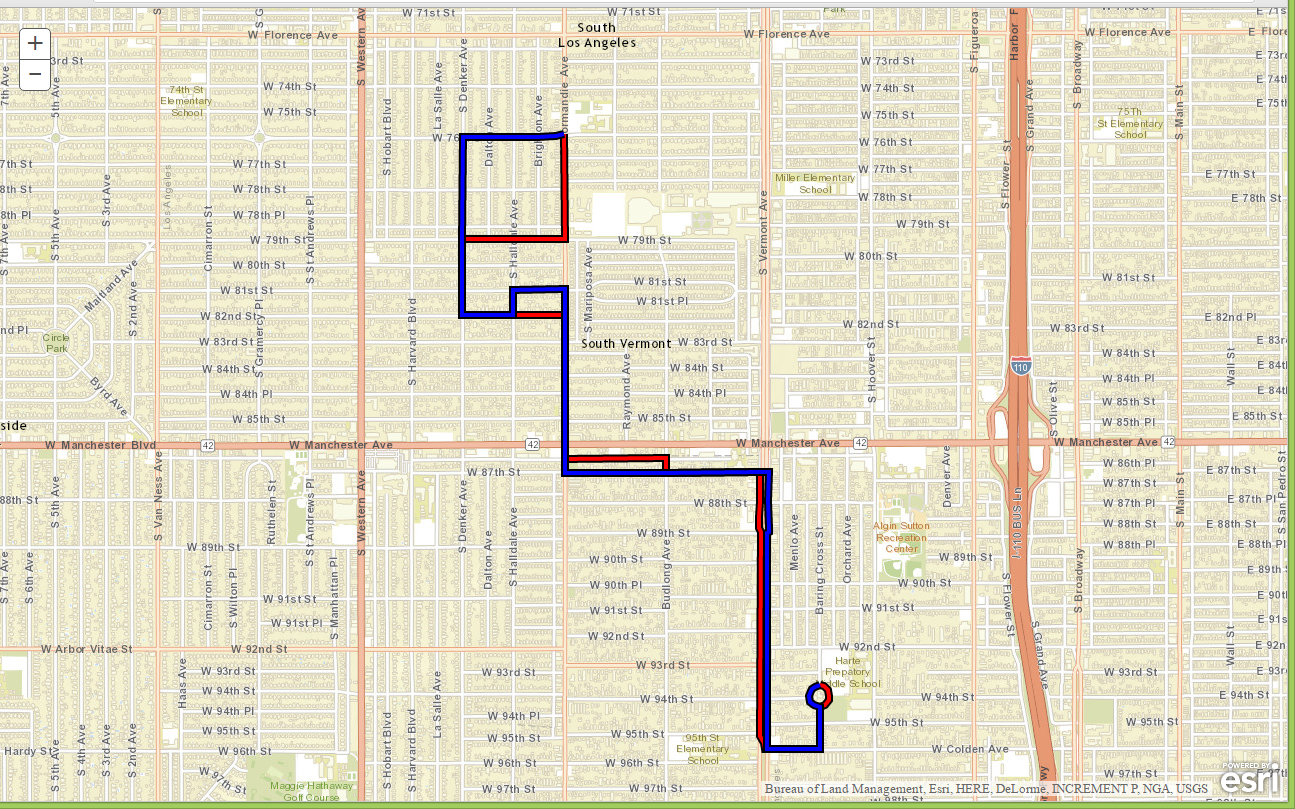
The JS Code:
<!DOCTYPE html>
<head>
  <title>SymbolForRoute</title>
  <meta http-equiv="Content-Type" content="text/html; charset=utf-8">
  <link rel="stylesheet" type="text/css" href="http://localhost/arcgis_js_api/library/3.16/3.16/esri/css/esri.css">
  <style>html, body, #mapDiv, .map.container{padding: 0; margin: 0; height: 100%;}</style>
</head>
  <div id="mapDiv"></div>
  <script>var dojoConfig = { parseOnLoad: true };</script>
  <script src="http://localhost/arcgis_js_api/library/3.16/3.16/init.js"></script>
  <script>


  var map, mapSpatialReference;
  var json, graphic, geometry, symbol;
  var routeLayer;


  require(["esri/map", "esri/geometry/Point", "esri/geometry/Polyline", "esri/geometry/Polygon", "esri/SpatialReference", "esri/symbols/SimpleMarkerSymbol", "esri/symbols/SimpleLineSymbol", "esri/symbols/TextSymbol", "esri/symbols/SimpleFillSymbol", "esri/symbols/Font", "esri/Color", "esri/renderers/UniqueValueRenderer", "esri/layers/GraphicsLayer", "esri/graphic", "esri/urlUtils", "esri/tasks/RouteTask", "esri/tasks/locator", "esri/tasks/RouteParameters", "esri/tasks/NATypes", "esri/tasks/FeatureSet", "esri/graphicsUtils", "esri/toolbars/edit", "esri/geometry/geometryEngine", "dojo/_base/event", "dojo/domReady!"],
  function (Map, Point, Polyline, Polygon, SpatialReference, SimpleMarkerSymbol, SimpleLineSymbol, TextSymbol, SimpleFillSymbol, Font, Color, UniqueValueRenderer, GraphicsLayer, Graphic, urlUtils, RouteTask, Locator, RouteParameters, NATypes, FeatureSet, graphicsUtils, Edit, geometryEngine, event) {

  Main();


  function Main(){
  InitLayers();
  LoadMap();
  };


  function InitLayers(){
  routeLayer = new GraphicsLayer({id: "routeLayer"});


  json = {
  "paths": [[[-118.30031412099999,33.971014280000077],[-118.30027129099994,33.967302321000034],[-118.30466853499996,33.967302321000034],[-118.30466853499996,33.96458973600005],[-118.30024273699996,33.96458973600005],[-118.30027129099994,33.959464377000074],[-118.29591687699997,33.959492930000067],[-118.29591687699997,33.958964690000073],[-118.29190986499998,33.958990864000043],[-118.29190986499998,33.957937953000055],[-118.29193960799995,33.957372831000043],[-118.29192771099997,33.957009963000075],[-118.29186227599996,33.956843400000025],[-118.29189796799994,33.949580096000034],[-118.29173735399996,33.949359996000055],[-118.29165407299996,33.949127998000051],[-118.28932814999996,33.949133947000064],[-118.28933409799998,33.950609213000064],[-118.28909615199996,33.950686545000053],[-118.28894148699999,33.950882851000074],[-118.28893553899997,33.951025618000074],[-118.28898312799998,33.951227872000061],[-118.28914374099998,33.951358743000071],[-118.28933409799998,33.951394435000054]]],
  "spatialReference": {"wkid": 4326}
  };
  geometry = new Polyline(json);


  symbol = new SimpleLineSymbol().setWidth(8).setColor("#000000");
  graphic = new Graphic(geometry, symbol);
  routeLayer.add(graphic);


  symbol = new SimpleLineSymbol().setWidth(4).setColor("#FF0000");
  graphic = new Graphic(geometry, symbol);
  routeLayer.add(graphic);


  json = {
  "paths": [[[-118.28933409799998,33.951394435000054],[-118.28952802399999,33.951327572000025],[-118.28964937699999,33.951252619000059],[-118.28971719199996,33.951181235000035],[-118.28978500599999,33.951002775000063],[-118.28973146799996,33.950813608000033],[-118.28958513099997,33.950681548000034],[-118.28933409799998,33.950609213000064],[-118.28932814999996,33.949133947000064],[-118.29159101499999,33.949128159000054],[-118.29157673999998,33.956834834000063],[-118.29149464899996,33.956874095000046],[-118.29148751099996,33.957038278000027],[-118.29153034099994,33.957959130000063],[-118.29152320199995,33.958976349000068],[-118.29190986499998,33.958990864000043],[-118.29591687699997,33.958964690000073],[-118.30026415199995,33.958962073000066],[-118.30024273699996,33.96458973600005],[-118.30024987599995,33.965497262000042],[-118.30248775899997,33.965482985000051],[-118.30248061999998,33.96458973600005],[-118.30466853499996,33.96458973600005],[-118.30466853499996,33.967302321000034],[-118.30464473999996,33.970906967000076],[-118.30139677599999,33.970914105000077],[-118.30063296899999,33.97094979700006],[-118.30031412099999,33.971014280000077]]],
  "spatialReference": {"wkid": 4326}
  };
  geometry = new Polyline(json);


  symbol = new SimpleLineSymbol().setWidth(8).setColor("#000000");
  graphic = new Graphic(geometry, symbol);
  routeLayer.add(graphic);


  symbol = new SimpleLineSymbol().setWidth(4).setColor("#0000FF");
  graphic = new Graphic(geometry, symbol);
  routeLayer.add(graphic);
  };


  function LoadMap(){
  map = new Map("mapDiv", {
  center: [-118.295,33.962],
  zoom: 15,
  basemap: "streets"
  });


  map.addLayers([routeLayer]);
  };
  })
  </script>
</html>
Environment:
ArcGIS API for Javascript 3.16
ArcGIS Desktop 10.4
- Mark as New
- Bookmark
- Subscribe
- Mute
- Subscribe to RSS Feed
- Permalink
- Report Inappropriate Content
I think you can only set offset for Point geometries by means of the graphic object definition.
For the Polyline graphic you could iterate through the line path and specify an offset for each coordinate:
var g = routeLayer.graphics[1];  // red line
var offset = 0.0001;  // decimal degrees
for (p in g.geometry.paths){
  var path = g.geometry.paths
;
  for (pnt in path){
    var xy = path[pnt];
    xy[0] += offset;
    xy[1] += offset;
  }
}
routeLayer.redraw();
- Mark as New
- Bookmark
- Subscribe
- Mute
- Subscribe to RSS Feed
- Permalink
- Report Inappropriate Content
There is a possible solution at this thread
How can I offset overlapping lines in Javascript API App?
Brandon Flessner propose this ArcGIS JavaScript Offset Lines - JSFiddle
- Mark as New
- Bookmark
- Subscribe
- Mute
- Subscribe to RSS Feed
- Permalink
- Report Inappropriate Content
a version with out offset run at every time can be found here