- Home
- :
- All Communities
- :
- Products
- :
- ArcGIS Spatial Analyst
- :
- ArcGIS Spatial Analyst Questions
- :
- Is anyway to Analysis without density?
- Subscribe to RSS Feed
- Mark Topic as New
- Mark Topic as Read
- Float this Topic for Current User
- Bookmark
- Subscribe
- Mute
- Printer Friendly Page
Is anyway to Analysis without density?
- Mark as New
- Bookmark
- Subscribe
- Mute
- Subscribe to RSS Feed
- Permalink
- Report Inappropriate Content
Hello everyone,
I have a question and since many days it makes me really busy.
I have 100 of questionnaire from an area from house holders which has 5 square Kilometers and my aim is: To analyze which area has most ownership, which area has less ownership and which area has rental houses?
When I am using density and IDW analysis, all show a value which means it analyses by population! so my question is how to do analyse without population density and only use number of houses based on ownership from attribute table which I explain before?
- Mark as New
- Bookmark
- Subscribe
- Mute
- Subscribe to RSS Feed
- Permalink
- Report Inappropriate Content
You don't need to be working with rasters in the first place and IDW interpolation is not really appropriate. Why don't you assign the counts for a class to a polygon and make a conventional map classed that way or as a percentage of the total.
This link and others in the area have some ideas Drawing a layer using categories—Help | ArcGIS for Desktop
- Mark as New
- Bookmark
- Subscribe
- Mute
- Subscribe to RSS Feed
- Permalink
- Report Inappropriate Content
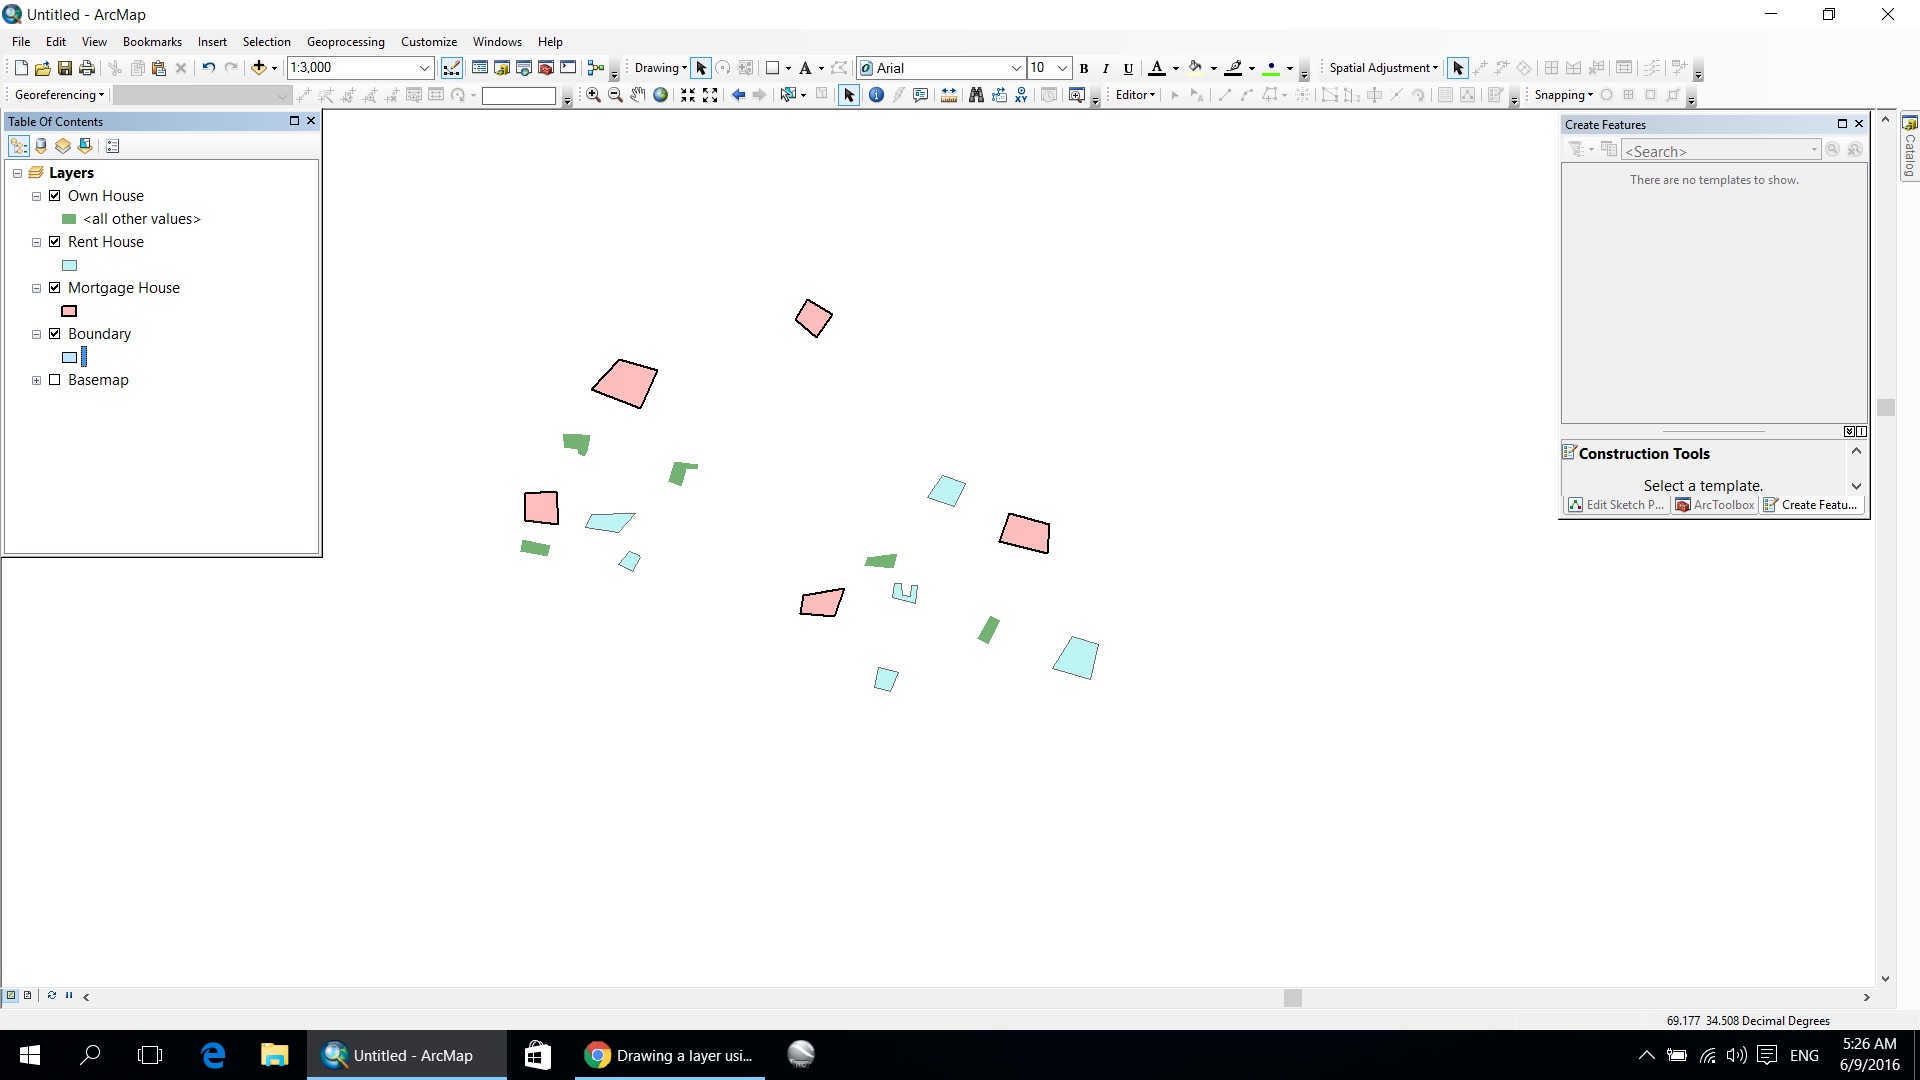
I have prepare a concept plan as your instruction. In first screen shot as you will see I draw polygons to houses which has ownership, rent and mortgage.
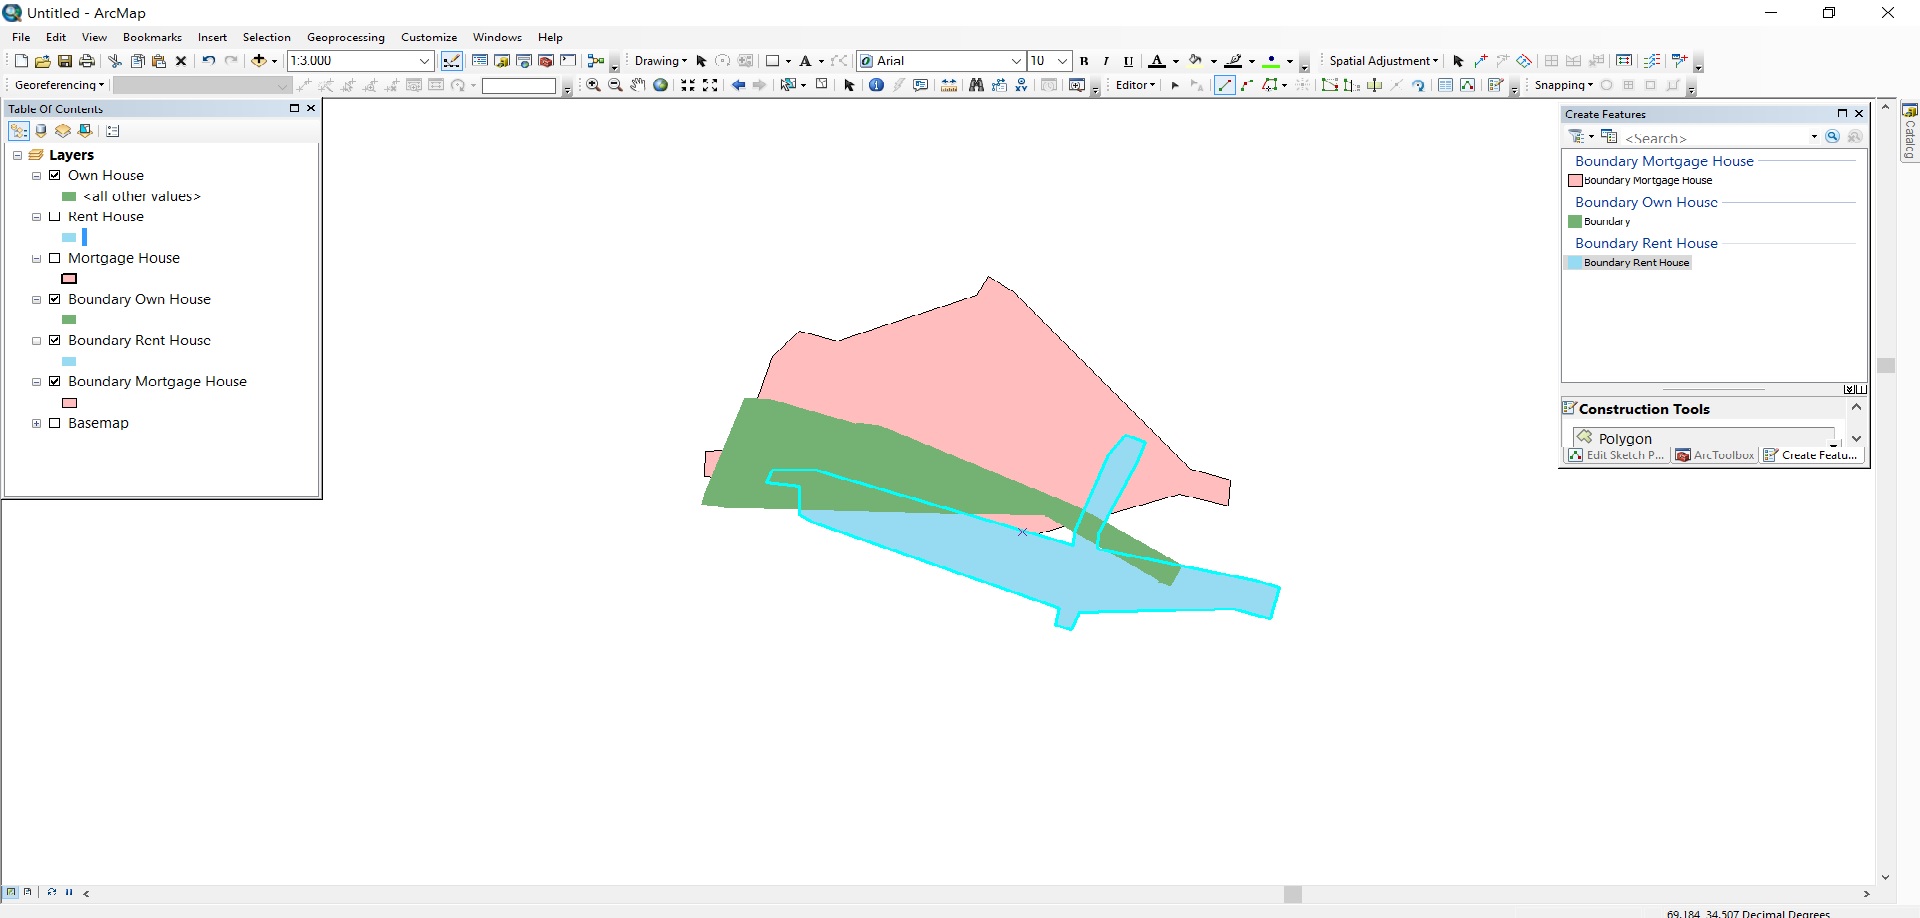
In second screenshot I want to analysis like that to show boundary of predicted or area neighborhood that in which area number of old houses has more ownership, rent and mortgage as my result.
- Mark as New
- Bookmark
- Subscribe
- Mute
- Subscribe to RSS Feed
- Permalink
- Report Inappropriate Content
I'm not quite sure how your data are set up. Do you have 100 questionaire points within 5km^2 each describing its own ownership situation (ownership = true/false), or do you have 100 points, each describing the own/rent situation within the surrounding 5km^2 (e.g. 25% rent, 75% own)?
- Mark as New
- Bookmark
- Subscribe
- Mute
- Subscribe to RSS Feed
- Permalink
- Report Inappropriate Content
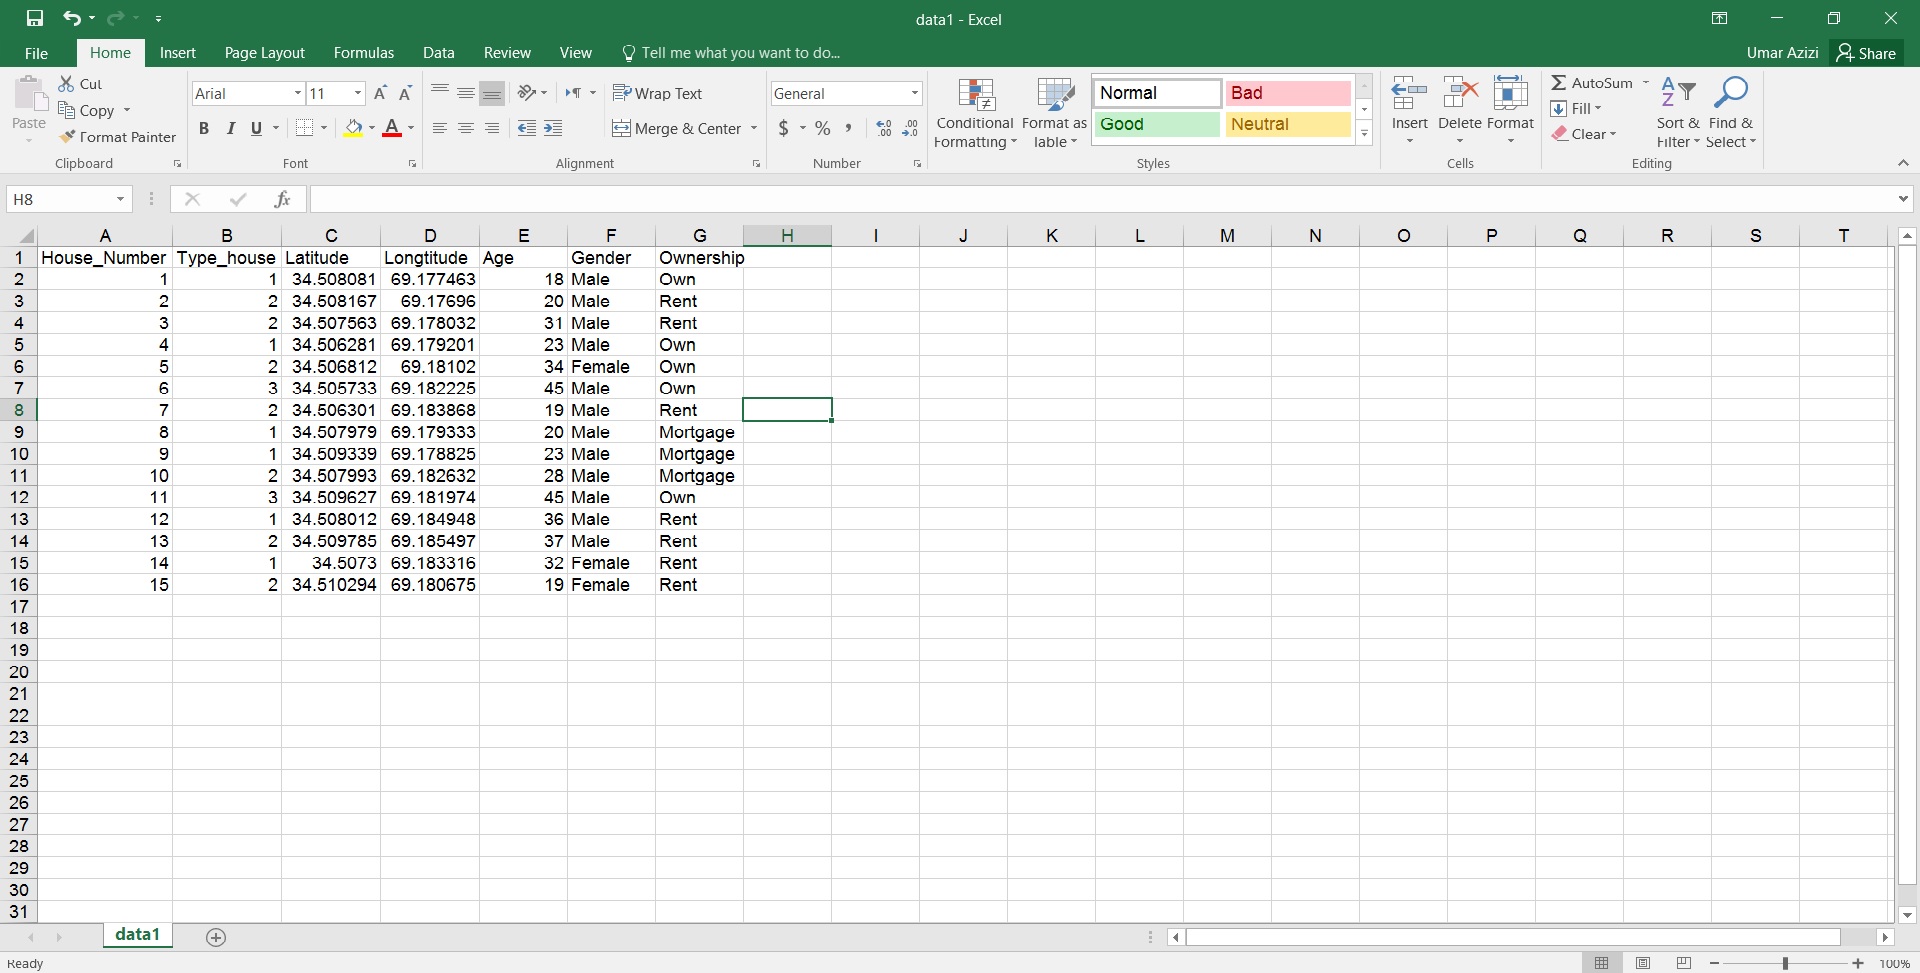
I have 100 questionnaire as points which export by excel. I categorize every house to:
1- Own
2- Rent
3- Mortgage
Means: House number is owner House number 2 is Rent House number 3 is Mortgage and continue like this up to 100
- Mark as New
- Bookmark
- Subscribe
- Mute
- Subscribe to RSS Feed
- Permalink
- Report Inappropriate Content
- Mark as New
- Bookmark
- Subscribe
- Mute
- Subscribe to RSS Feed
- Permalink
- Report Inappropriate Content
Here's my immediate idea (whether or not it is technically appropriate, I'm not sure):
1.) Add three new fields (own, rent, mortgage)
2.) If ownership = Own, make the own field = 1, else 0. Same for the other two fields.
3.) Run your interpolation (IDW or other) separately for each situation
4.) Your interpolated rasters should be between 0 and 1 (those are the estimated percentage of each situation at each pixel)
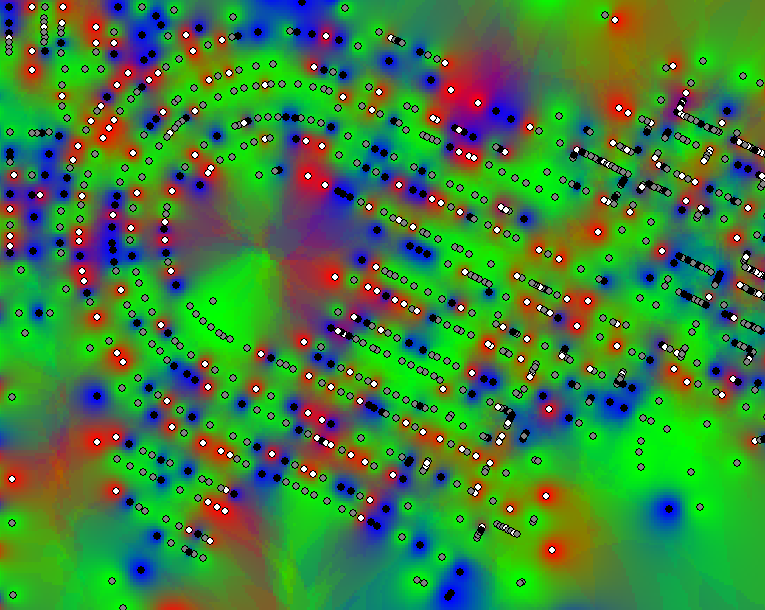
5.) For display, multiply each of your rasters by 255. Then, run Composite bands using those rasters to make a new raster with red = own, green = rent, blue = mortgage. You should end up with something like this:
- Mark as New
- Bookmark
- Subscribe
- Mute
- Subscribe to RSS Feed
- Permalink
- Report Inappropriate Content
Problem with interpolation of a non-continuous variable can be thought of as follows. 1000 people live here and 2000 people live there, how many live in between? 1500 ?. No, these could be two small towns on either side of a large city or there could be a lake in-between. Population, lightning strikes, tree diameter are all examples of non-continuous data that should not be interpolated.
-Steve
- Mark as New
- Bookmark
- Subscribe
- Mute
- Subscribe to RSS Feed
- Permalink
- Report Inappropriate Content
That is why I am spending my many days and can't find a good solution for what I want to do. Between every houses there is thousand of houses and how its possible that GIS can predict?!
I just can figure out the only way that I can do it is show existing of houses with a color and label by symbology But, I wonder how all people can do different analysis and so happy!