- Home
- :
- All Communities
- :
- Products
- :
- Mapping
- :
- Mapping Questions
- :
- How do I take XY from a Point Feature Class and ad...
- Subscribe to RSS Feed
- Mark Topic as New
- Mark Topic as Read
- Float this Topic for Current User
- Bookmark
- Subscribe
- Mute
- Printer Friendly Page
How do I take XY from a Point Feature Class and add it to a Data table?
- Mark as New
- Bookmark
- Subscribe
- Mute
- Subscribe to RSS Feed
- Permalink
- Report Inappropriate Content
I'm still attempting to load well data from Drilling Info for permits in a certain county and have them connect the surface hole to the bottom hole with a line. I've gotten to the step where I have added the XY using the XY Tool but they are in a feature not in the actual data table. I need to get the XY data into a data table first, and then somehow merge the surface and bottom holes into the same document.
I need help with how to take the XY's generated in the point feature class table (see image) and move them to a data table?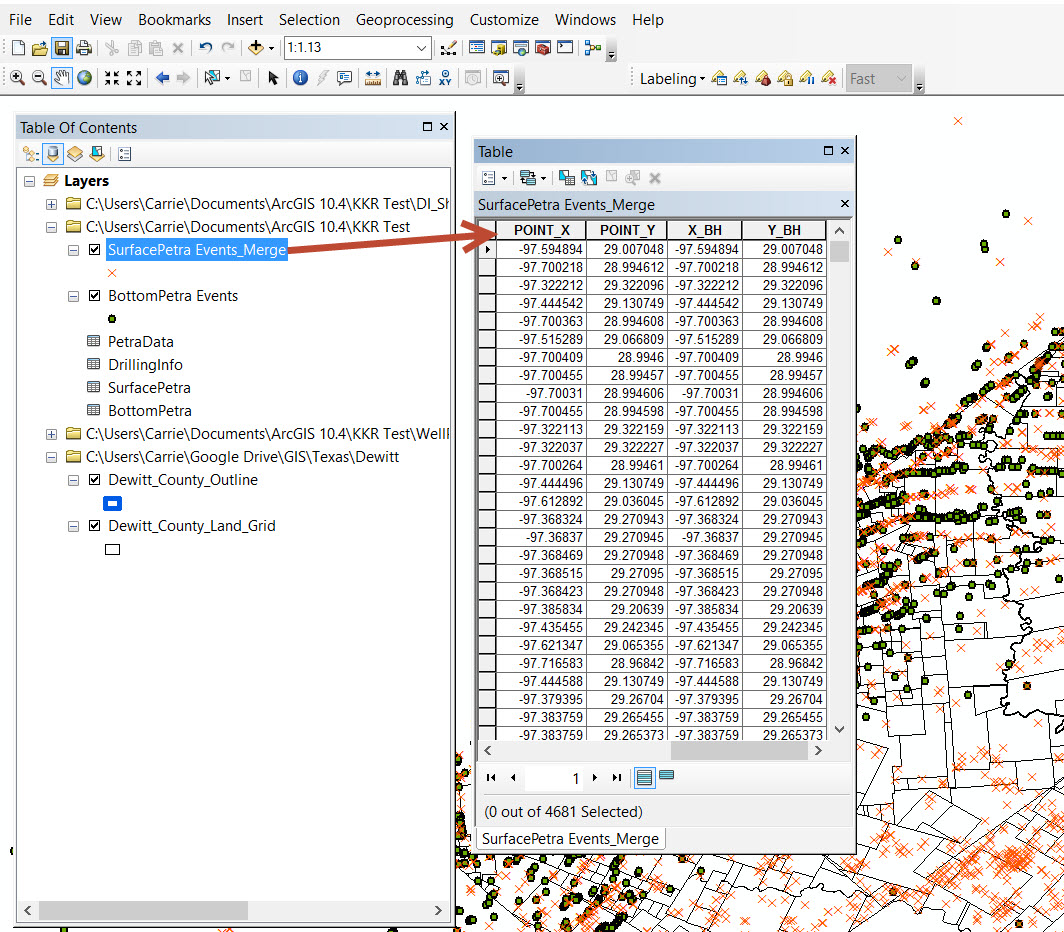
- Mark as New
- Bookmark
- Subscribe
- Mute
- Subscribe to RSS Feed
- Permalink
- Report Inappropriate Content
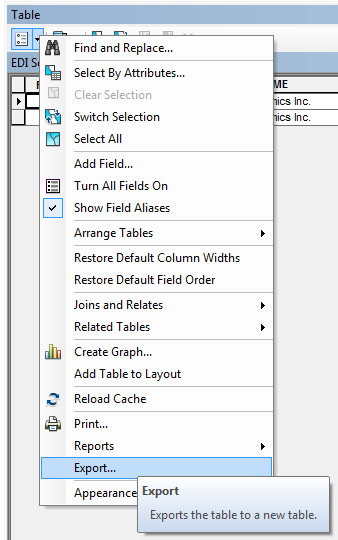
Not sure I understand, but you can export the feature class table to a standalone table, from within the attribute table options:
- Mark as New
- Bookmark
- Subscribe
- Mute
- Subscribe to RSS Feed
- Permalink
- Report Inappropriate Content
I started using GIS on Monday after a one day class. I didn't learn about all the tools and where they were. Thanks for letting me know about the export button, I will try that and see if that gets me closer.
- Mark as New
- Bookmark
- Subscribe
- Mute
- Subscribe to RSS Feed
- Permalink
- Report Inappropriate Content
Ditto with Darren here. I am a bit confused.
In the table you show, you have the XY coords twice. Why do that.
Normally, a drilling collar table (the location of the hole) would have a format something like this :
BoreholeID, CollarX, CollarY, CollarZ, Dip, Azimuth, EOHDepth.. maybe some other info here.
Usually it is easy to import this table (usually from excel), into a geodb, then make a PointZ feature from it.
I have a tool which can then generate a PolylineZM (the drill trace) from this. Its all done in python.
Unfortunately (at 10.3.1), the XY to line tool (in the toolbox) doesn't include the Z coordinate, so no out of the box solution.
- Mark as New
- Bookmark
- Subscribe
- Mute
- Subscribe to RSS Feed
- Permalink
- Report Inappropriate Content
This takes about two minutes to plot inside of Petra, and I'm trying to get it to work in GIS. I've written to another help board and was trying to follow the steps that person gave me to convert the Lat/Lon of the SHL and BHL to XY Coords and then use the XY to Line tool to connect them using the API #. (I have no idea who has the best method so am trying several methods out). This person further instructed me to then try to Merge the tables together (which I did I think). Now I have all the XY's for the SHL and the BHL for the wells in the same point feature.
However, I need them in a table format in order to use that particular tool. (Sorry if my explanation is long winded, or using the wrong terminology) I'm literally less than one week into using this software.
- Mark as New
- Bookmark
- Subscribe
- Mute
- Subscribe to RSS Feed
- Permalink
- Report Inappropriate Content
If the double set of coordinates are simply the result of recalculating the geometry for that layer, then save it to a table as suggested, then you will have to join it to your other table Add Join tool if you intend to use it in the XY To Line Tool. This would only be useful for a 2D surface representation. I assume you are trying to get this Feature To 3D By Attribute tool where you depths are in a different file
- Mark as New
- Bookmark
- Subscribe
- Mute
- Subscribe to RSS Feed
- Permalink
- Report Inappropriate Content
For this method, I don't need to use the directional surveys. I simply want to connect them "as the crow flies" straight line from SHL to BHL. I'm not trying to do a 3-D image or use the azimuth, TVD etc. To clarify, I need to just do a 2-D representation.
The "double set" is from some method I did yesterday which I can't recall (possibly the copy rows tool?). I took the XY's in the BHL table and just added two new fields. I copied the BHL to a new field called BH_XY, and BH_XY etc. so that when I merged them together I could tell the difference between the ShL and BHL and didn't want to have issues when merging that I had two columns with the same name.
- Mark as New
- Bookmark
- Subscribe
- Mute
- Subscribe to RSS Feed
- Permalink
- Report Inappropriate Content
There is also a long list of complications which are caused by bad data. I have multiple wells which have Lat=0, or Lon=0, or that are missing BHLs because they are vertical wells. I had to code in using Python some new fields to try to remove the bad data, and also try to get rid of all the zero data points. I was trying to find a easy method to clean this data up and then put the cleaned up data into tables before I tried to plot the data.
I only have access to Drilling Info's permit data layer. I have multiple entries for each API. I tried to use a Pivot table to sort by "last date of update" for the data but that doesn't work because of the source. In Petra this problem is avoided by simply using a sort when importing to make it load based on API and permit date and then it will overwrite as the data comes in. Right now I haven't convinced myself of the load order of GIS so was just trying to clean up the data the best I could with an export from Petra without trying to use the really screwed up Drilling Info data.
- Mark as New
- Bookmark
- Subscribe
- Mute
- Subscribe to RSS Feed
- Permalink
- Report Inappropriate Content
Sounds like a bit of a nightmare.
But deal with it logically.
If all you require is a 2d representation of the drill path, all you need is
TopOfHoleX, TopOfHoleY, BottomOfHoleX, BottomOfHoleY in the same table.
Then you can use the XY to Line tool.
- Mark as New
- Bookmark
- Subscribe
- Mute
- Subscribe to RSS Feed
- Permalink
- Report Inappropriate Content
I'm leaning towards a Pivot table by last update date, by each the SHL and the BHL and then doing a V Lookup to join them back up to a one-line format. If I don't lose steam I'll keep you updated on my progress towards my goal! As hard as I try I still end up with all of these multiple entries in GIS. Unless you know of a way to make GIS think each API is unique and then subsequently load the data in there so the last change gets recorded only?