- Home
- :
- All Communities
- :
- Products
- :
- Geoprocessing
- :
- Geoprocessing Questions
- :
- Linear Referencing - Ridership Analysis
- Subscribe to RSS Feed
- Mark Topic as New
- Mark Topic as Read
- Float this Topic for Current User
- Bookmark
- Subscribe
- Mute
- Printer Friendly Page
- Mark as New
- Bookmark
- Subscribe
- Mute
- Subscribe to RSS Feed
- Permalink
- Report Inappropriate Content
Hi,
I have a circular bus route polyline feature class and associated bus stop point feature class. Bus stops have information on boarding and alighting data for each stop. Would like to build a Linear Referencing System and utilize dynamic segmentation to visualize the ridership along the specified bus route. Any help would be appreciated.
Thanks
Solved! Go to Solution.
Accepted Solutions
- Mark as New
- Bookmark
- Subscribe
- Mute
- Subscribe to RSS Feed
- Permalink
- Report Inappropriate Content
You should use some tolerance distance with the tool in case the bus stop points are not exactly on the line (even the slightest offset will prevent events from being generated). You have to create a geodatabase topology to get your lines and points to snap with enough precision that you could use a tolerance of 0.
If that still does not work, make sure both the lines and points are in the same projection and try selecting features in both layers as inputs to the Locate Features Along Route tool.
If none of that works, post a screenshot picture of what you have created. It may reveal something I have not thought about.
One other note. I explicitly set the M tolerance and M Resolution in the geoprocessing environment to at least 0.01 and 0.001 respectively before running the Create Route tool to make sure the measures are precise and not just whole number measures.
- Mark as New
- Bookmark
- Subscribe
- Mute
- Subscribe to RSS Feed
- Permalink
- Report Inappropriate Content
did you go through the Lessons
- Mark as New
- Bookmark
- Subscribe
- Mute
- Subscribe to RSS Feed
- Permalink
- Report Inappropriate Content
Yes, I have gone through them. I am trying to relate ridership data to the
bus route network. Results are not as expected
- Mark as New
- Bookmark
- Subscribe
- Mute
- Subscribe to RSS Feed
- Permalink
- Report Inappropriate Content
Good to know you have gone through the background. You will have to elaborate on "results are not as expected" with examples of your inputs, expectations and outputs
- Mark as New
- Bookmark
- Subscribe
- Mute
- Subscribe to RSS Feed
- Permalink
- Report Inappropriate Content
Thanks for the reply
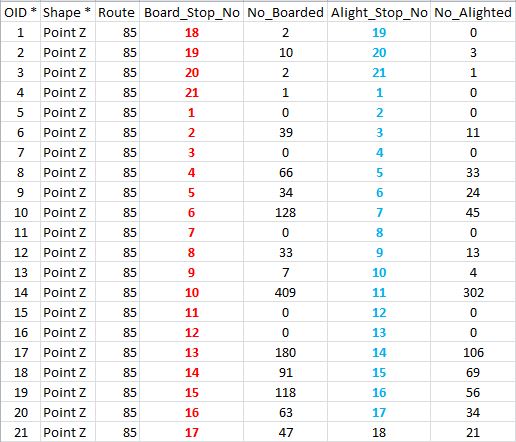
I have attached sample data for reference. I would like build relationship between route network and ridership data. Then I imagine, board and alight stop numbers in ridership data could be used as measure values for the linear feature
Ridership Data
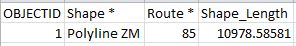
Bus Route Attributes
- Mark as New
- Bookmark
- Subscribe
- Mute
- Subscribe to RSS Feed
- Permalink
- Report Inappropriate Content
Continuing from my earlier post.
Once I am able set up referencing as described, I could probably then dynamically visualize the ridership on linear feature
Thanks
- Mark as New
- Bookmark
- Subscribe
- Mute
- Subscribe to RSS Feed
- Permalink
- Report Inappropriate Content
First create the route with stop 1 as the beginning and end of the line. If you use the Create Route tool, you have to remove a very small segment from the end of the line to break the loop, run the tool, and then move the end vertex to close the loop again, since it cannot create a route from a closed loop polyline. The Route ID would be the same as the Route field in your table for each line.
Then, since your stops are points, use the Locate Features Along Route tool to create an event table of the points, Uncheck the option to find the closest route only, since you want Stop 1 to have both a measure of 0 and a measure of the end of your route, Remove events that got associated with the wrong route where two routes cross or parallel each other.
Now run the Sort tool to get the Route IDs and the measures to sort in order. Add a TO_MEAS double field and a Long field called NextID and calculate NextID to be the ObjectID of each record plus 1. Duplicate the table. Join the ObjectID field of one of the tables to the NextID field of the other and select all records where the RouteIDs of the two tables match. Calculate over the measure of the joined record into the master table. Now you have two measures and can display each record as a line segment for each of your stop pairs using a Line Event layer.
- Mark as New
- Bookmark
- Subscribe
- Mute
- Subscribe to RSS Feed
- Permalink
- Report Inappropriate Content
Thanks Richard for your reply.
- Mark as New
- Bookmark
- Subscribe
- Mute
- Subscribe to RSS Feed
- Permalink
- Report Inappropriate Content
Hi Richard,
Sorry, I couldn't reply sooner. Earlier I tried as you suggested in your post, but I guess I am missing out on something
Firstly, I created bus line feature class with both start and end point at one point.Removed small segment from the end of the line.
Then created route using "Create Route" tool with "Length" as measure source
Later when I tried Locate Features Along Route for bus stops, I am getting an empty table. Not sure why.
Can you please advise
Thanks
Anand
- Mark as New
- Bookmark
- Subscribe
- Mute
- Subscribe to RSS Feed
- Permalink
- Report Inappropriate Content
You should use some tolerance distance with the tool in case the bus stop points are not exactly on the line (even the slightest offset will prevent events from being generated). You have to create a geodatabase topology to get your lines and points to snap with enough precision that you could use a tolerance of 0.
If that still does not work, make sure both the lines and points are in the same projection and try selecting features in both layers as inputs to the Locate Features Along Route tool.
If none of that works, post a screenshot picture of what you have created. It may reveal something I have not thought about.
One other note. I explicitly set the M tolerance and M Resolution in the geoprocessing environment to at least 0.01 and 0.001 respectively before running the Create Route tool to make sure the measures are precise and not just whole number measures.