- Home
- :
- All Communities
- :
- Products
- :
- Imagery and Remote Sensing
- :
- Imagery Questions
- :
- File size increase when projecting raster
- Subscribe to RSS Feed
- Mark Topic as New
- Mark Topic as Read
- Float this Topic for Current User
- Bookmark
- Subscribe
- Mute
- Printer Friendly Page
- Mark as New
- Bookmark
- Subscribe
- Mute
- Subscribe to RSS Feed
- Permalink
- Report Inappropriate Content
Why when is it that when I project a raster from Alaska state plane zone 4 feet to Web Mercator does the file size increase so dramatically? It starts at ~29MB before it is projected and then increases to ~257MB after projection.
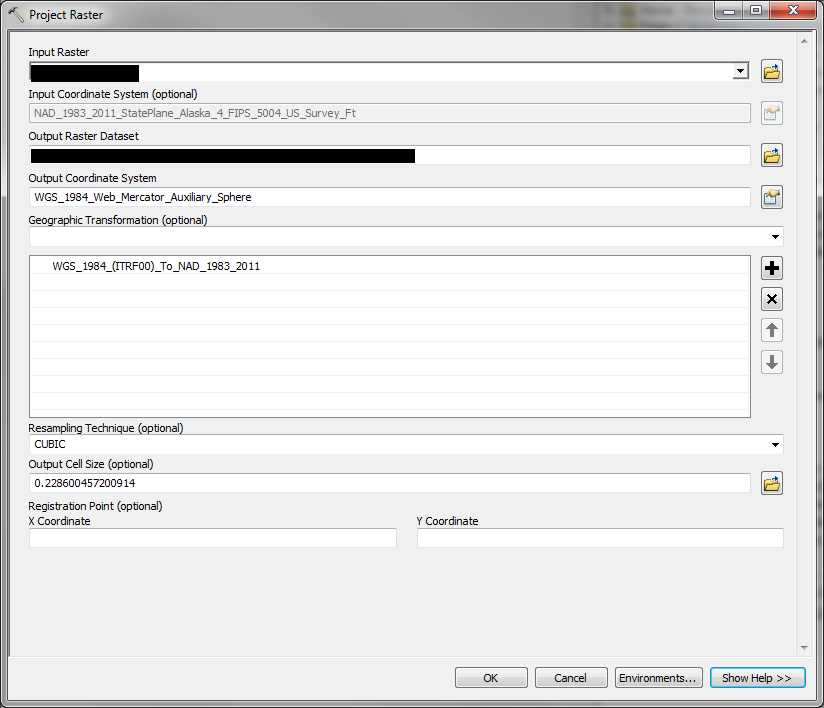
NAD_1983_2011_StatePlane_Alaska_4_FIPS_5004_US_Survey_Ft
WGS_1984_Web_Mercator_Auxiliary_Sphere
The only thing I can think of is that the distortion in web mercator at high latitudes is causing the raster to be "stretched" in some way and then leading to an increase in file size.
Thanks for any input.
Solved! Go to Solution.
Accepted Solutions
- Mark as New
- Bookmark
- Subscribe
- Mute
- Subscribe to RSS Feed
- Permalink
- Report Inappropriate Content
Forest
I thought I should summarize, although the post by Gabriel Upchurch summarized this pretty well – and your initial assumption [that this is caused by the inherent distortion of Web Mercator at high latitudes] was correct. I should have realized the details sooner.
In the Web Mercator projection, the scale increases as (1/(cosine of Latitude)) so at 60deg it is 2x larger (2x scale error), and your data is at about 70 degrees latitude, so the scale error is almost exactly a factor of 3. Cosine(70) = .3420. That means it is a proper implementation for a Web Mercator projection that a distance of 100 meters will be reported to appear to be 300 meters. I had not realized this distortion would be embedded into a reprojected file, but it is necessary for compatibility with the coordinate system. Multiplied in 2 dimensions, this (3x3) distortio is a factor of ~9, so your input file (29 MB) becomes almost 250 MB after reprojection.
This really emphasizes the disadvantage of using a projected coordinate system too far from its origin. If all of your work will be at high latitudes, it would be better to use a local coordinate system, assuming any measurements will be made on the map.
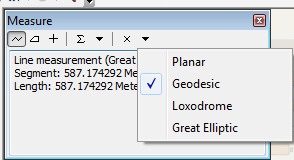
Note I did some testing, and verified that the ArcGIS Online web map compensates for the distortion, so it provides generally accurate measurements. (Exactly how accurate, I do not know – I would need to ask our experts…)
Also note that ArcGIS Desktop has options for how it reports measurements. It will default to "PLANAR" measurements when using the measure tool (which does NOT compensate for the scale distortion), but the tool has the option to choose "GEODESIC" which will provide accurate local measurements.
Options to consider:
- The best option is to use the Mosaic Dataset to serve your imagery directly from its original format, and the application that consumes it can request any projection (AK State Plane, Web Mercator, other) and ArcGIS will project on the fly. For this, you will need our Image Extension, and I’m trying to confirm if your client already has it. The advantage is you won’t have to duplicate data on disk (either as export to Web Mercator *or* in raster tile cache format).
- Sub-option here – you do not need the image extension to serve one single image e.g. an orthomosaic of a single project site – but I’m guessing you have more than one site/one image and you would want to use a Mosaic Dataset & thus the Image Extension…
- If the web map needs to support measurements, consider building your web maps/apps in Alaska State Plane or another appropriate coordinate system. It is not mandatory for web maps/apps to use the Web Mercator projection, but that raises the question of what other data must appear in your maps…
- If you want to proceed with services using Web Mercator, I think they can be fine for visualization at Latitude 70 degrees (but at even more extreme latitudes I think the distortion would be unacceptable). If your users expect to make any measurements, you will need to consider and test the Web Mercator scale issues carefully.
- If you do proceed in Web Mercator, I’d suggest you cache directly from the Mosaic Dataset. The cache may increase in size due to the scaling, but you should use JPG format (assuming your images are continuous imagery or a hillshade of elevation data), and keep the scale changes due to the projection in mind – if you want the visual quality of a level 19 cache, you can actually start at level 18 (1/4 the data volume) and you won’t lose visual quality. Again, we should test a small area first to be sure!
- Note I had forgotten that your data file was 32 bit float. If this is elevation data, then the raster tile cache format is not usable – it is limited to 8 bits, 3 bands. We can share elevation data as a compressed 3D surface (different cache format), so if you need to share elevation values, this is a separate discussion. But note that using a dynamic image service, shared from a Mosaic Dataset, solves this…
- Mark as New
- Bookmark
- Subscribe
- Mute
- Subscribe to RSS Feed
- Permalink
- Report Inappropriate Content
Esri has a technical article discussing some of these reasons:
28470 - Why does the data bit depth increase when a raster is projected, rotated, or clipped?
This can result in file size changes:
30560 - Why does the file size of my raster image change when I export or create a new image?
- Mark as New
- Bookmark
- Subscribe
- Mute
- Subscribe to RSS Feed
- Permalink
- Report Inappropriate Content
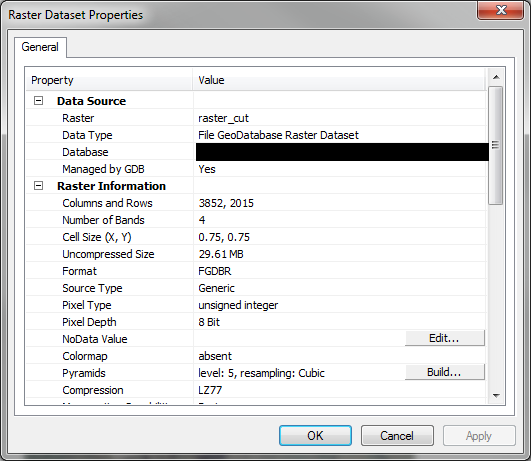
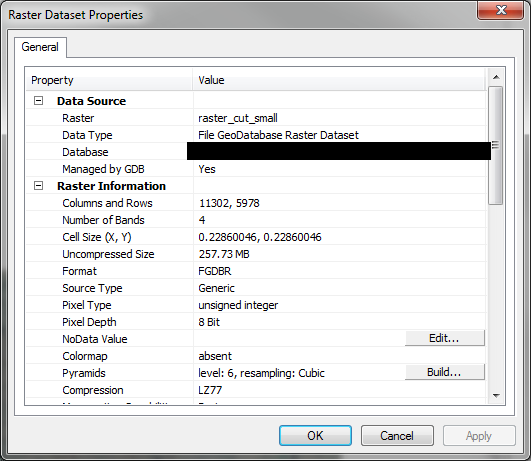
Also, looking at your image, raster_cut_small contains more columns and rows; the cells are smaller, and there's a higher level for pyramids. All of this results in more data contained within the file.
- Mark as New
- Bookmark
- Subscribe
- Mute
- Subscribe to RSS Feed
- Permalink
- Report Inappropriate Content
Thanks for the info; however, both images are 8 bit.
- Mark as New
- Bookmark
- Subscribe
- Mute
- Subscribe to RSS Feed
- Permalink
- Report Inappropriate Content
Interesting. It appears there has been a considerable addition of rows and columns. The proportional difference in rows and columns is almost identical to the proportional difference in file sizes. I would symbolize your NoData cells to see if that is where all the extra rows and columns are hiding.
- Mark as New
- Bookmark
- Subscribe
- Mute
- Subscribe to RSS Feed
- Permalink
- Report Inappropriate Content
Gabriel Upchurch:
Interesting. It appears there has been a considerable addition of rows and columns. The proportional difference in rows and columns is almost identical to the proportional difference in file sizes. I would symbolize your NoData cells to see if that is where all the extra rows and columns are hiding.
For sure the extra size has to be coming from the increase in rows and columns. But why is this happing? I would think that it would have more or less the same number of rows and columns as the original because:
Which is the cell size that the tool selected.
- Mark as New
- Bookmark
- Subscribe
- Mute
- Subscribe to RSS Feed
- Permalink
- Report Inappropriate Content
It appears you are confusing comments by two different people. You are exactly correct about the cell sizes since there was a conversion from feet to meters between the two systems. The cells are still the same size so this is not why the datasets are different sizes.
Did you symbolize the NoData as I (Gabriel Upchurch) suggested? My guess is that the dataset was rotated during the transformation which resulted in a large areas of NoData cells being added in the corners.
- Mark as New
- Bookmark
- Subscribe
- Mute
- Subscribe to RSS Feed
- Permalink
- Report Inappropriate Content
I am sorry that I mixed your comments up Gabriel and Chris.
Gabriel, the extra rows and columns are not in no data (well a few of them are for sure but not 1000s of them).

No data in magenta.
- Mark as New
- Bookmark
- Subscribe
- Mute
- Subscribe to RSS Feed
- Permalink
- Report Inappropriate Content
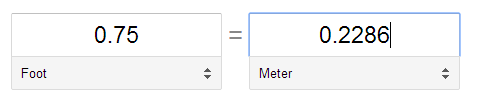
Thanks for checking the NoData. I did some testing this morning and was able to reproduce your issue and think I have figured out what is occurring. It appears you are encountering the common issue of projection distortion. In the case of Web Mercator the distortion is largely in distance and area and with your data being so far from the system's origin, the distortion is sizable. To put it simply, a 0.228 meter cell in Web Mercator does not cover an equivalent area on the ground as a 0.75 feet cell in Alaska State Plane. To represent the same area on the ground while complying with the specified output cell size, the software is adding additional cells. The behavior is further exacerbated because you are going from a local coordinate system that is highly accurate in terms of distance and area to a global coordinate system that is highly inaccurate in terms of distance and area.
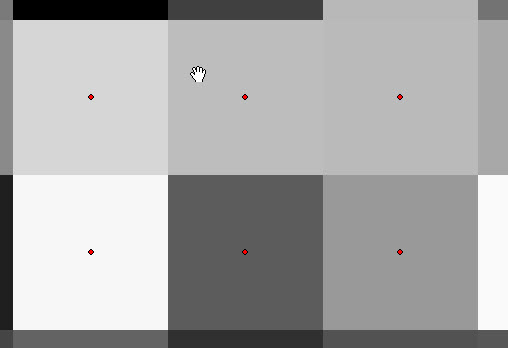
The additional cells are not obvious because the software does a good job of maintaining the pattern in the data. I didn't have any AK data so I generated a random raster for testing purposes and I was unable to visually determine that cells were added. To confirm that cells were actually being added during the projection process I used the Raster to Point tool.
This first screenshot shows points representing the cell centers in the Alaska State Plane dataset.
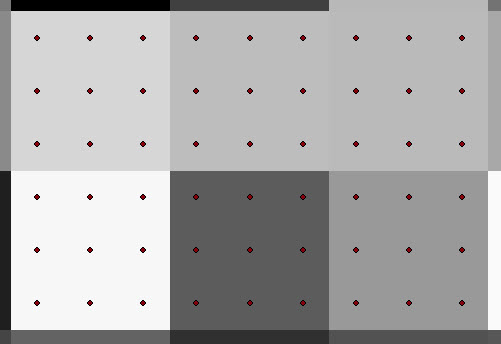
This second screenshot shows points representing the cell centers after projecting to Web Mercator.
- Mark as New
- Bookmark
- Subscribe
- Mute
- Subscribe to RSS Feed
- Permalink
- Report Inappropriate Content
I wondered the same when Forest created the thread - he even mentioned that as a possibility. Alaska would definitely experience a high degree of distortion in web mercator - thanks for providing examples.