- Home
- :
- All Communities
- :
- Products
- :
- Mapping and Charting Solutions
- :
- Mapping and Charting Questions
- :
- XY Scatter plot behaviour 10.2 vs 10.3
- Subscribe to RSS Feed
- Mark Topic as New
- Mark Topic as Read
- Float this Topic for Current User
- Bookmark
- Subscribe
- Mute
- Printer Friendly Page
XY Scatter plot behaviour 10.2 vs 10.3
- Mark as New
- Bookmark
- Subscribe
- Mute
- Subscribe to RSS Feed
- Permalink
- Report Inappropriate Content
First a bit of background. I have a mxd which uses XY scatter plots for analytical data attached to samples. Each scatter plot is set to plot only selected data. The idea is, select the samples (points) on the map, the graphs update. Cool so far. In 10.2, if you selected some points where there was no analytical data, a little message would appear at the bottom of the relavent graph saying "Nothing selected". Fine at least you know to ignore that plot. Now at 10.3, this behavior has changed. Now you get no message. It just plot all the data... Arrrggg.
See attached pics of the situation as is now. These are dummy random points and the XY scatter plot is simply plotting the XY coord into the graph.
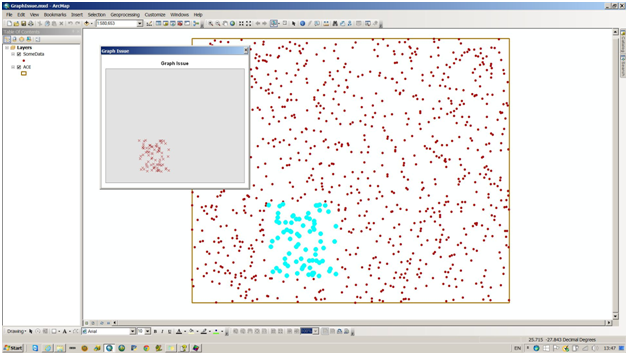
Here, with nothing selected, the graph plots all of the data.

Had some correspondence with esri South Africa support, emailed my example (mocked up) dataset, and they sent it to esri Redlands. All well and good.
After the usual to-ing and fro-ing, an analyst has responded thus :
I am writing in reference to the incident #01666933.
This change in behavior is effective from ArcMap 10.3 onwards and I believe
it is expected behavior. A documentation enhancement has already been logged
for this and I have gone ahead and attached it to the case. The details are
below:
ENH-000086760 : Display of selected features for graphs has been changed in
ArcMap 10.3 when the "Show only selected features/records on the graph"
option within the general properties is set.
For updates on this issue, please see the ESRI Customer Care Portal by going
to - https://customers.esri.com
I understand if this causes inconvenience to the user. If the user would
like to have the pop up of "There is no selection" at the bottom of the
graph when no records are selected, he may visit the Ideas Site and post the
idea there. Link: http://ideas.arcgis.com
So I now have to post an IDEA to fix something that didn't need fixing.......
So, the question is :
Should the behavior stay as it was, (1) issue a warning when nothing is selected,
or (2), plot all the data when nothing is selected.
I tried to make a poll out of this post but the interface got to me, couldn't do it.
Could someone help please.
Could I have some opinions on this issue please.
Thanks
- Mark as New
- Bookmark
- Subscribe
- Mute
- Subscribe to RSS Feed
- Permalink
- Report Inappropriate Content
100+ views and no comments?
Come on people.... Esri, where are you?